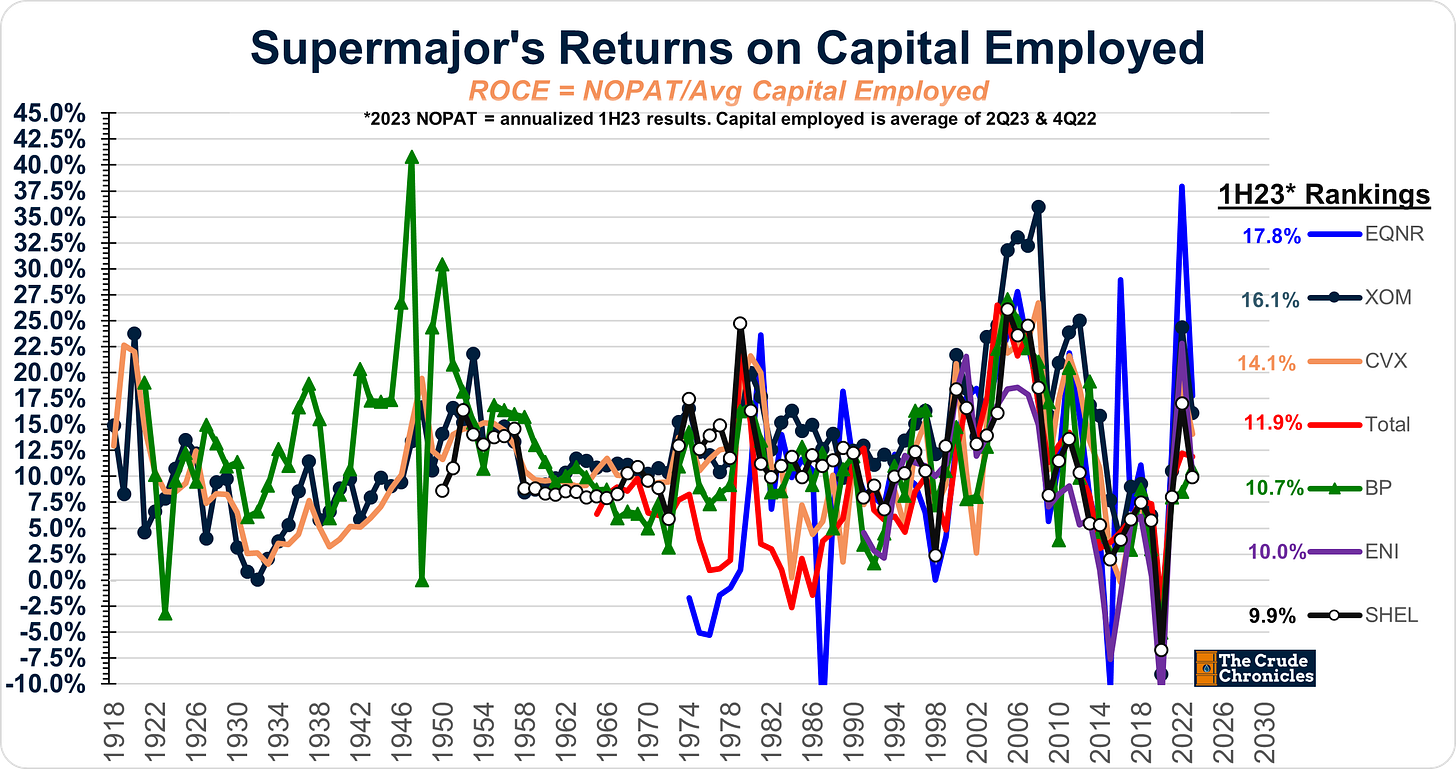
Big Oil's Mid Year ROCE Report Card - (sometimes it's more an art than a science)
With 2Q earnings now wrapped up I figure we take a look at how the ever-important metric of returns on capital faired for the sector halfway through the year.
In this post, we will review:
How annualized 1H23 returns stacked up vs. history.
Attempt to triangulate what level of returns the market is “discounting” for the integrated oils.
Show why returns can remain above their LT average.
Before we get started, I want to clarify my approach. To calculate the annualized returns for 1H23, I used the 1H YTD numbers and multiplied them by two to come to a net operation profit after tax [NOPAT=EBIT x (1-t)] and used the December 2022 and the most recent 2Q balance sheets.
Enough about the accounting, let’s begin.
How annualized 1H23 returns stacked up vs. history.
As shown below, given the 1H weakness in energy prices, returns on capital softened from their 2022 levels.
The ranking remains unchanged with EQNR leading the pack followed closely by the U.S. companies of XOM and CVX.
The euro oils of Total, BP, ENI, and Shell continue to lag this cycle. Unlike in 2020, the companies' messaging has shifted back to more of a focus on traditional O&G where the returns have been stellar (HERE).
But talk is cheap and returns don’t lie.
It is not unusual to experience pullbacks during an overall upward trend. Through studying historical patterns, I have observed that ROCE tends to occur in ~3 waves with each peak and trough surpassing the previous one before it all comes crashing down and the cycle repeats.
However, if we apply a market cap-weighted average, we get the following picture.
Keep reading with a 7-day free trial
Subscribe to The Crude Chronicles to keep reading this post and get 7 days of free access to the full post archives.


