The Gist (1) Lost decades for U.S. equities (1880s, 1910s, 1940s, 1970s, 2000s & 2030s) tend to be when energy’s real returns rise to the top. O&G market cap to GDP points to real returns of 8-9% per annum. (2) Energy experiences relative multiple expansion during times of rising inflation due to higher EPS growth that returns cash to shareholders faster via higher dividend yields. (3) But the good times don’t last forever. If excess earnings yield is a guide, the next cycle peak for energy will be in the early 2030s, at which point energy will once again enter another one of its own ‘lost decades’.
"The crowd madnesses recur so frequently in human history that we must regard them as an integral part of the way men behave."
Charles Mackay wrote the above in his widely read investing book, Extraordinary Popular Delusions and the Madness of Crowds.
It was one of the first recommended books I read upon entering the world of investing, suggested by the Chief Equity Strategist that trained me so many years ago, Barry Bannister.
Below I also use a chart inspired by him.
Equity markets have reached valuation levels that are stretched relative to any sort of fundamental anchor such as earnings, sales and replacement values. In conjunction, participation by the public has never been higher.
I can’t help but wonder: Is this the equity market's Icarus flying too close to the sun?
And more importantly, what impact might this have on the energy equities if we face another 'Lost Decade' for large cap (growth) stocks?
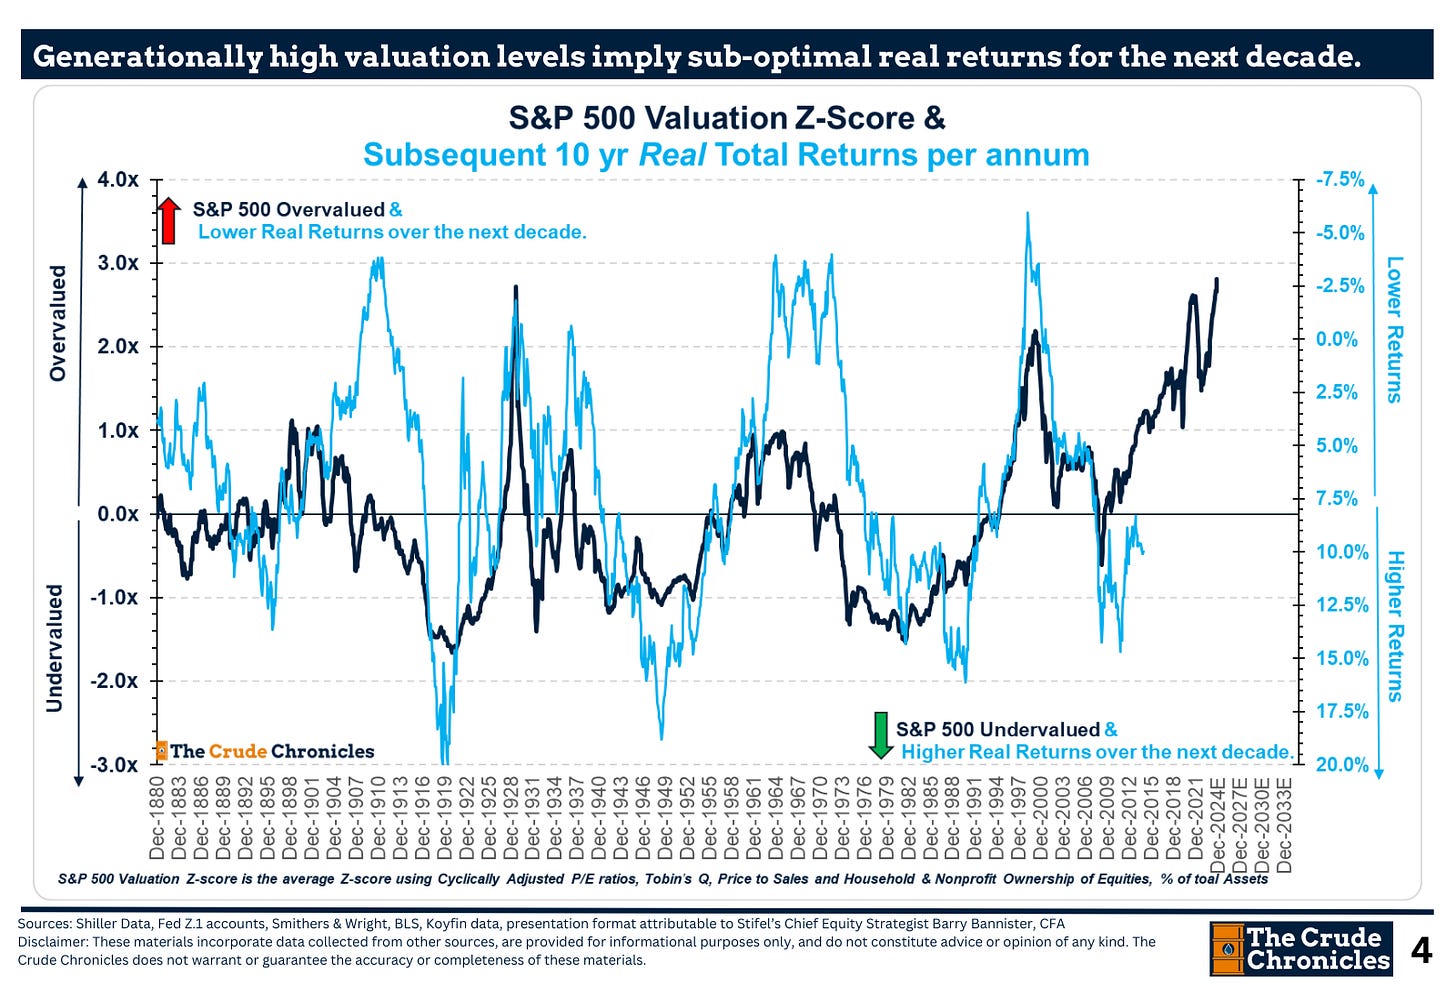
By transforming the lines in the above chart to a standardized z-score and plotting the subsequent decade’s inflation-adjusted total returns, we obtain the following chart.
The takeaway is that such high valuations often lead to suboptimal real returns.
This has sparked a heated debate among Wall Street strategists, and even the Oracle of Omaha may be stockpiling cash in anticipation of more challenging times (HERE).
After nailing the Japan call, who’s to say he won’t do the same with U.S. equity markets?
I’m in the camp that we’re headed for another secular bear market in large-cap growth equities, especially as inflation has returned with a vengeance.
Transforming the previous chart, I demonstrate that during these 'lost decades' for U.S. large-cap growth equities (the 1880s, 1910s, 1940s, 1970s, 2000s, and 2030s—occurring in regular 30-year intervals), energy returns tend to rise to the top, as shown below.
Keep reading with a 7-day free trial
Subscribe to The Crude Chronicles to keep reading this post and get 7 days of free access to the full post archives.


