
Have you heard of my SAPE ratio?
Have you heard of my SAPE ratio?

I am sure that you have heard of Shiller’s famous and widely quoted Cyclically Adjusted Price to Earnings Ratio or CAPE for short.
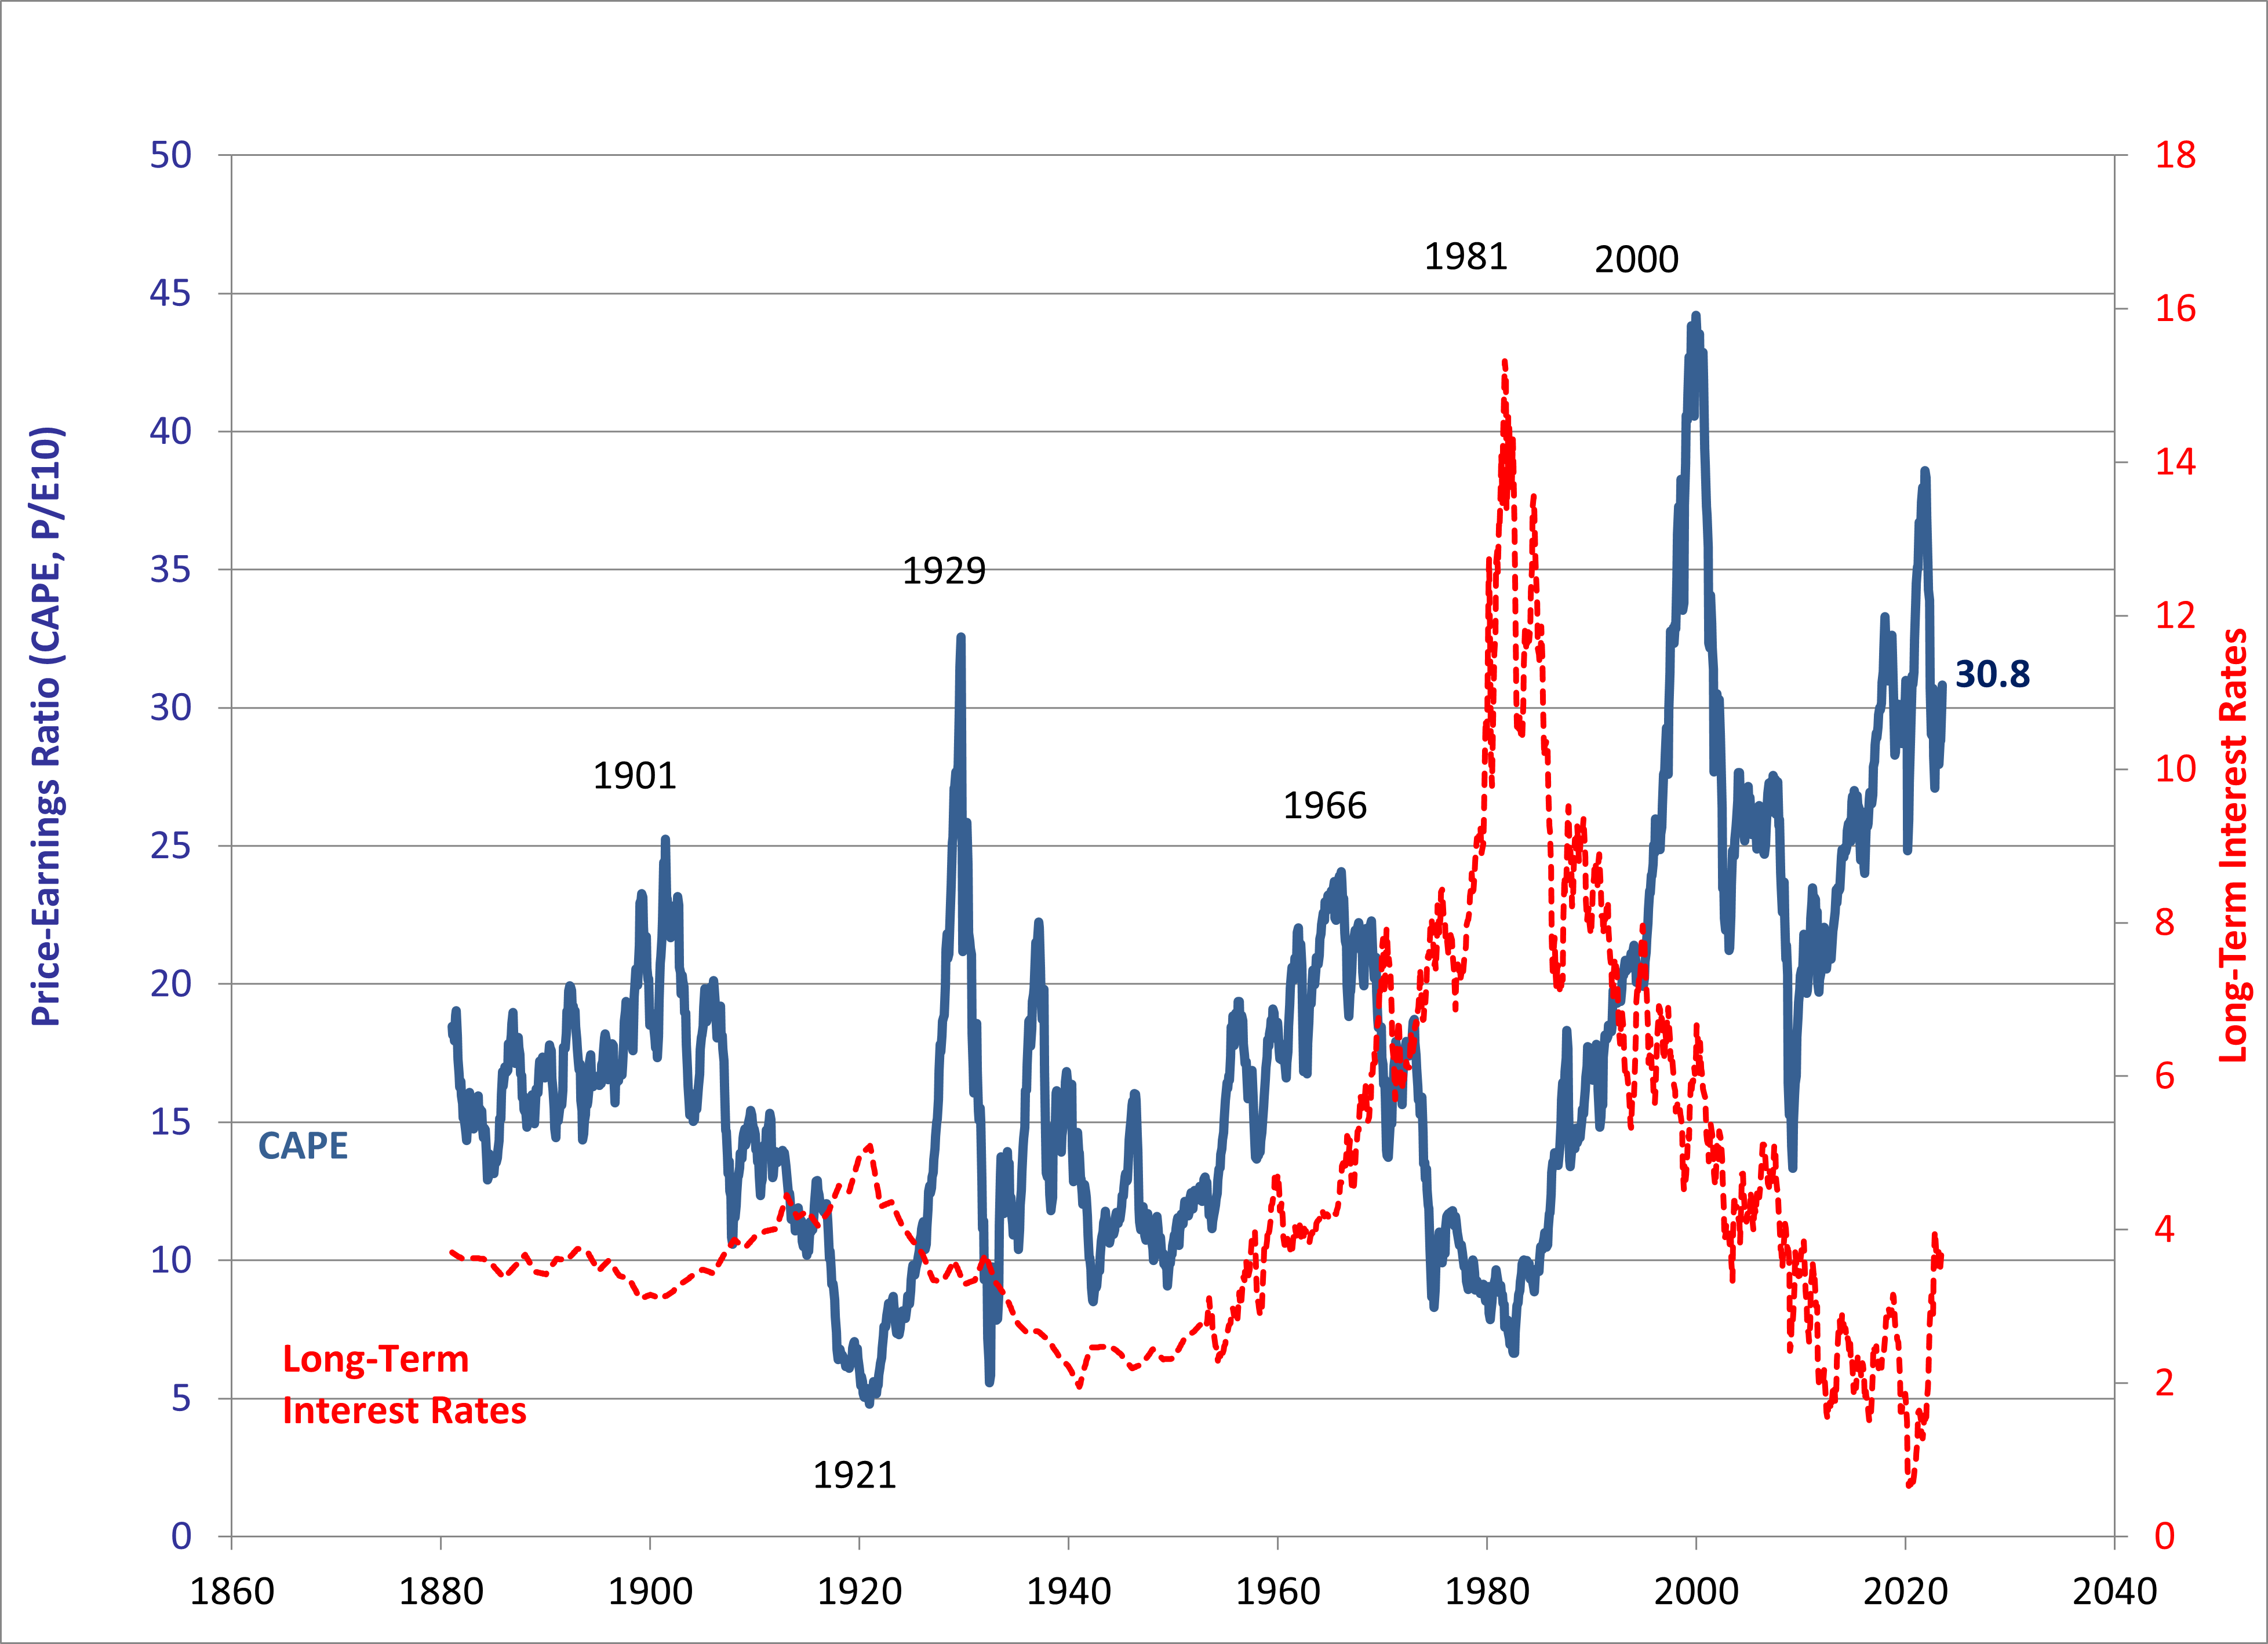
It’s a fantastic piece of research wherein the creators reconstructed a market cap-weighted index going back several years (HERE).
Shiller’s CAPE ratio is based on average inflation-adjusted earnings from the previous 10 years to minimize the short-term impacts.
But cycles in energy are longer than 10 years.
By now you have probably seen my chart below which shows oil divided by stocks (i.e. S&P 500).
On average, these cycles tend to trade price leadership every 13 years.
So if you were to apply Shiller’s 10-yr lookback, you wouldn’t get the best view of average inflation-adjusted earnings.
In the chart below, I use my Crude Chronicles Energy Index (CCEI) and divide it by inflation-adjusted earnings from the previous 26 years to come up with my Secularly Adjusted Price to Price-to-Earnings ratio, or SAPE for short.
Keep reading with a 7-day free trial
Subscribe to The Crude Chronicles to keep reading this post and get 7 days of free access to the full post archives.