

Her Majesty's British Petroleum. The Financial History (2022 edition)
(the story of the first National Oil Company told via charts)

For the last 2 months I have been working on putting together the financial history for BP.
Never did I think the company would be center stage to the events occurring in Ukraine.
But looking back, this company has been at the epicenter of almost every geopolitical events especially when oil is one of the key pieces on the chess board.
This goes back to the roots of this company when Winston Churchill capitalized it (the first official national oil company) in order to secure crude oil supplies from Persia as the British Navy was switching from coal to oil as part of its arms race with the Kaiser’s Germany.
These are a collection of charts of BP from those early days to now.
Enjoy.
Revenue & Profitability Charts
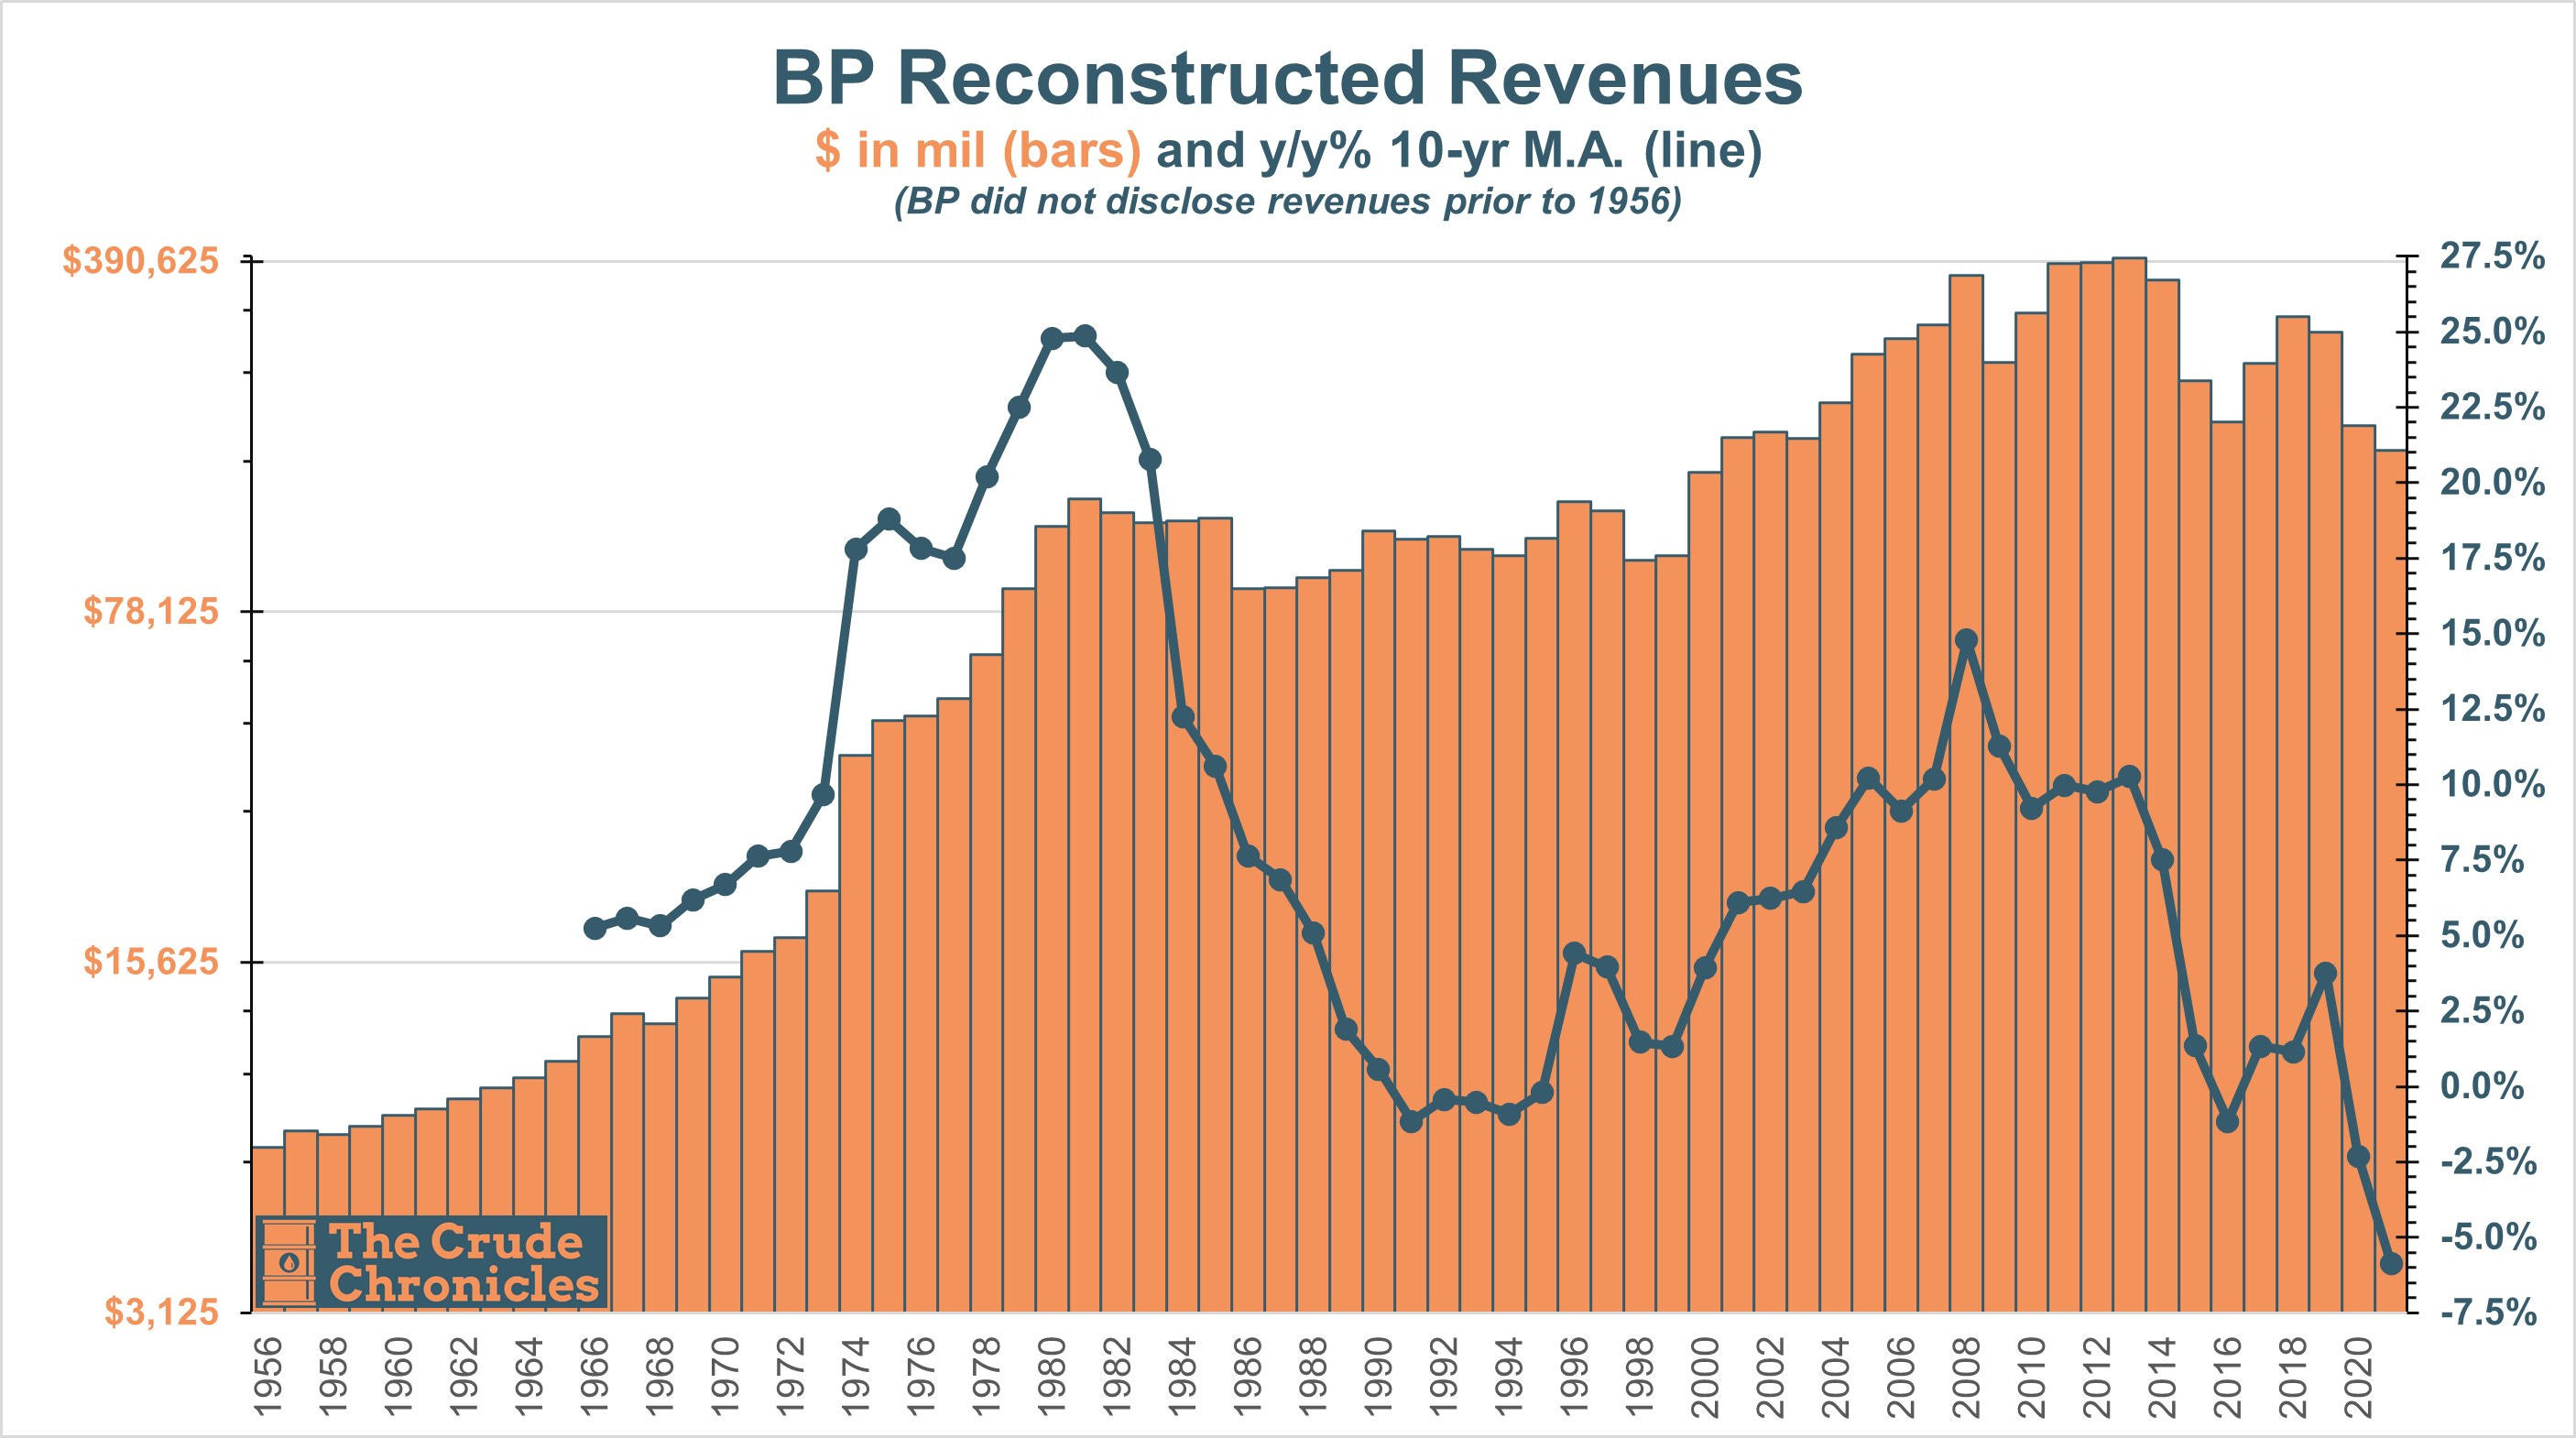
Below is the pro-forma revenue for BP.
Prior to 1956, BP did not disclose revenues…stinks.
The blue line is a 10-yr moving average of the y/y change in revenue which approximates a CAGR.
Below is the pro-forma net profits for BP including all the acquired companies. For these margin charts, revenue data is unavailable prior to 1956.
Keep reading with a 7-day free trial
Subscribe to The Crude Chronicles to keep reading this post and get 7 days of free access to the full post archives.