What’s up Chroniclers?!
As many of you know, I study oil cycles and the massive outlier thus far in this cycle has been the lack of a capital spending (capex).
The narrative is pretty clear at this point around the subject.
managements’ and shareholders’ interests are better aligned,
the uncertainty around ESG/climate policy,
a preference by shareholders’ for cash returns, etc.
Even if oil execs wanted to grow they can’t get casing, rigs, sand, etc. You name it.
Nonetheless, let’s look at some capex charts for the supermajors going back 100+ years to get a view of where we are relative to history.
First some housekeeping:
My charts include data from the 5 integrated oil companies (IOCs) XOM, CVX, BP, RDS & TTE as well as COP and all acquired companies so close to 50+ entities.
COP is in there because I have a hard time letting go of the past when they were once an integrated. Plus it gives us some N. American shale mix.
I use the terms IOCs (international oil companies) and supermajors interchangeably.
As I continue to build out my library of companies I will add more (hint, OXY, HESS and MRO/Ohio Oil are in the mix).
The common theme you will see across all these charts is they are underspending big time relative to history.
OK, let’s begin
First in the deck is capex growth rates, on a 5-yr smoothed basis.
Supermajors Capex Growth Rates since 1923
This is an industry that oscillates between -5% at the low end and +20% at the high end on a 5-yr smoothed basis.
2017-2019 was the lowest in history and as you can see, the chart turned up in 2021.
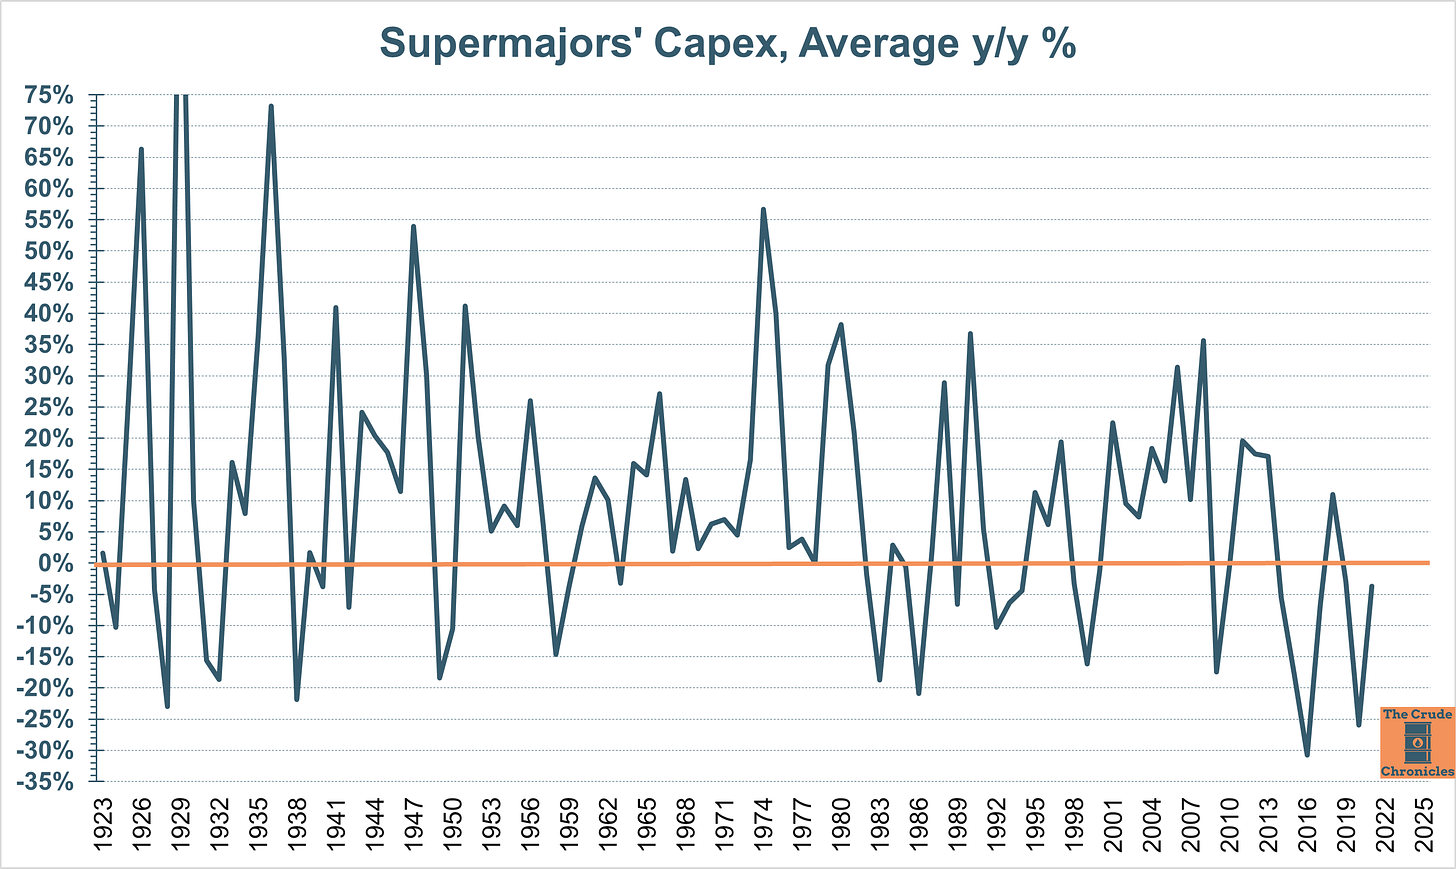
The latest data point in the chart drops the 2016 growth number which was the LOWEST in history as shown below.
Average y/y growth rate. 2021 saw an improvement in change.
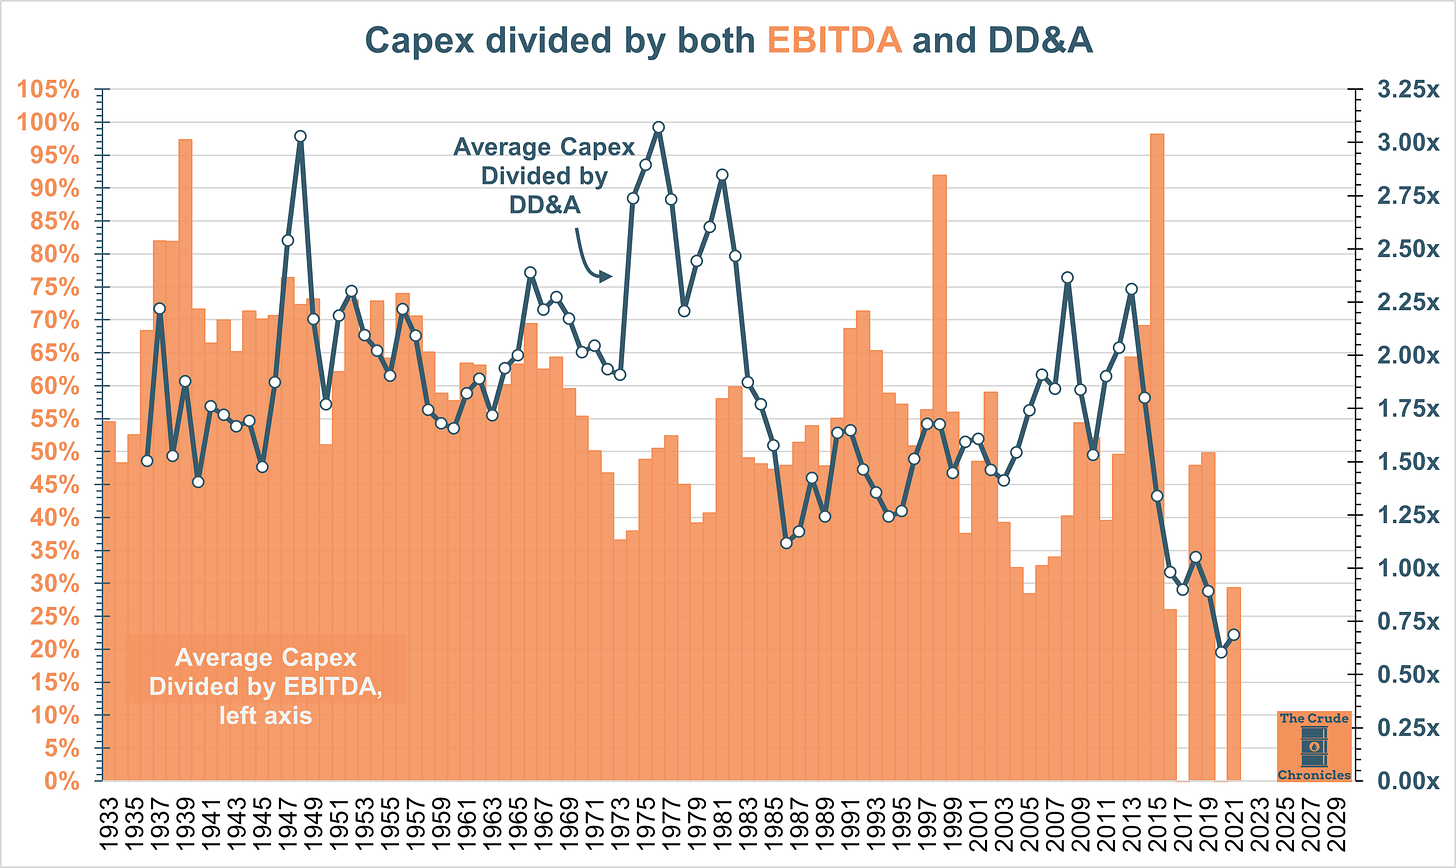
Capex divided by EBITDA and DD&A shown below.
Capex/EBITDA first measures spending relative to cash flows.
Capex/DD&A measures what companies are replacing versus using.
Capex relative to both EBITDA and DD&A
The industry has round tripped below 1971 and 2005 levels.
Given that some of the companies included such as XOM, CVX and COP are Permian producers the capex intensity of shales is super low versus historical basins such as offshore N. Sea, GoM, Alaska, Middle East, Venezuela, etc.
You need long laterals and a frac crew not large FPSOs, deep water rigs, offshore platforms or prohibitive tax regimes. God bless Texas.
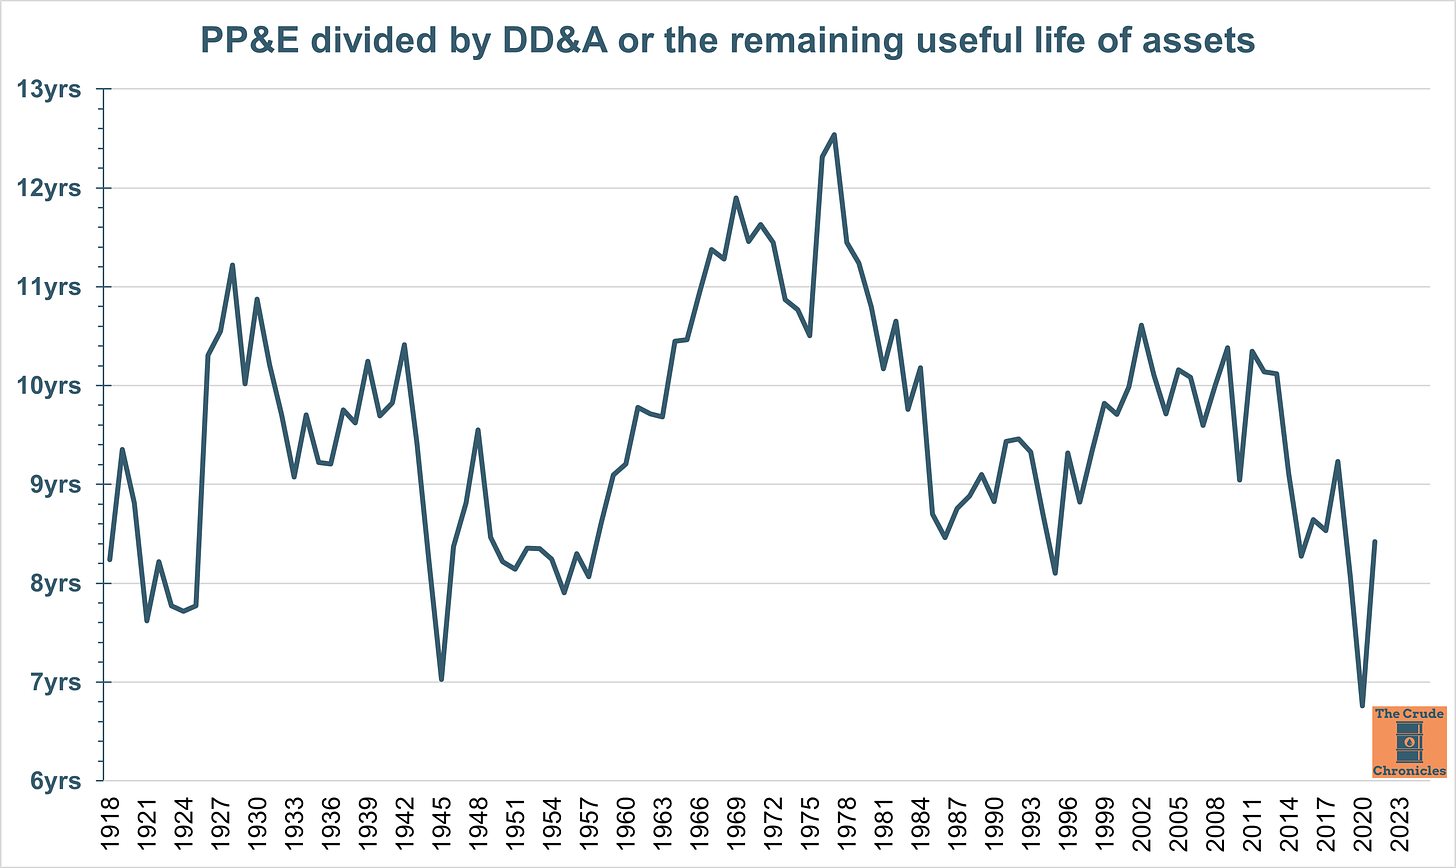
Next up is PP&E divided by DD&A which is a proxy for the remaining shelf life of assets.
I can take this chart back a bit further because balance sheet data was disclosed.
What is the shelf life of the assets? PP&E divided by DD&A
When the line is rising, they are spending and putting shelf life on the assets and vice versa when it is falling.
2021 saw a recovery in the ratio from the 2020’s historical lows but not a trend.
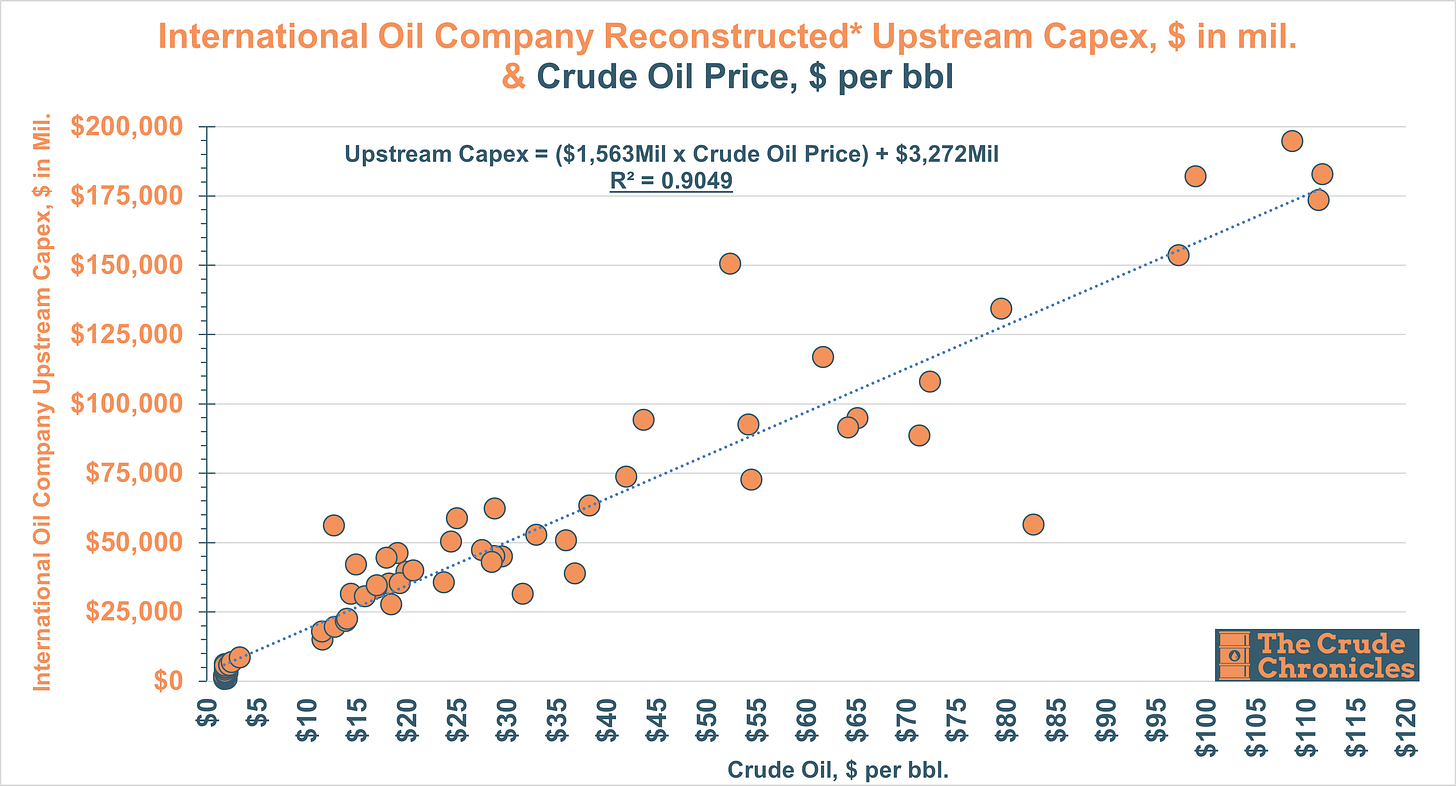
You probably saw these next two charts in my post from 2 weeks ago (HERE)
Conclusion - At these crude prices, the supermajors’ upstream spending should be $172B a year. 2021 was $56B!
The biggest disconnect between capex and crude in 70+ years.
Let’s apply algebra 101 to the previous chart.
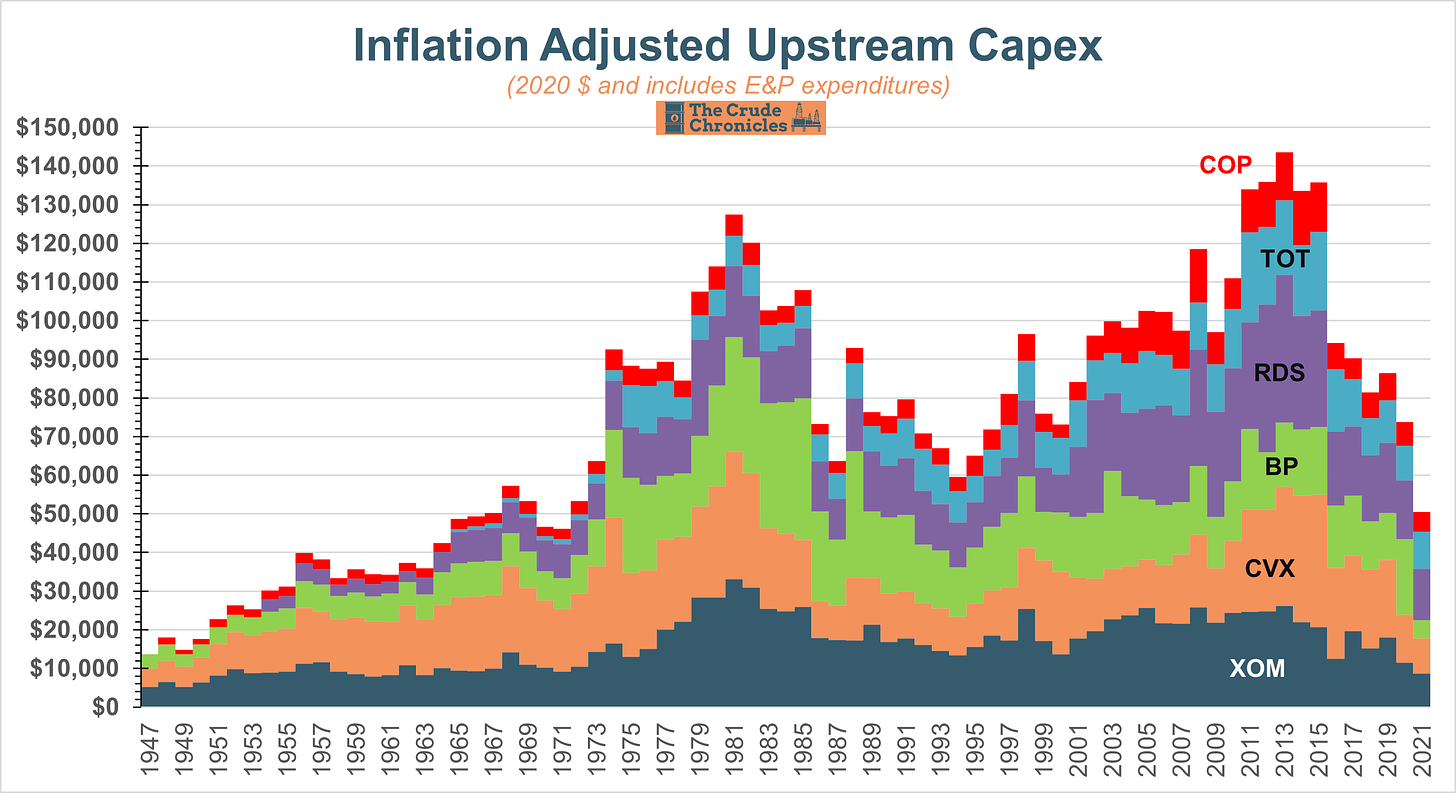
Breaking out capex into its main components, let’s look at upstream spending below.
This chart is adjusted for inflation as well.
Note - Instead of CPI as a deflator I used a linked series of inflation for upstream capex and BLS data on PPI for oilfield machinery and equipment.
Inflation adjusted upstream capex for the big boys.
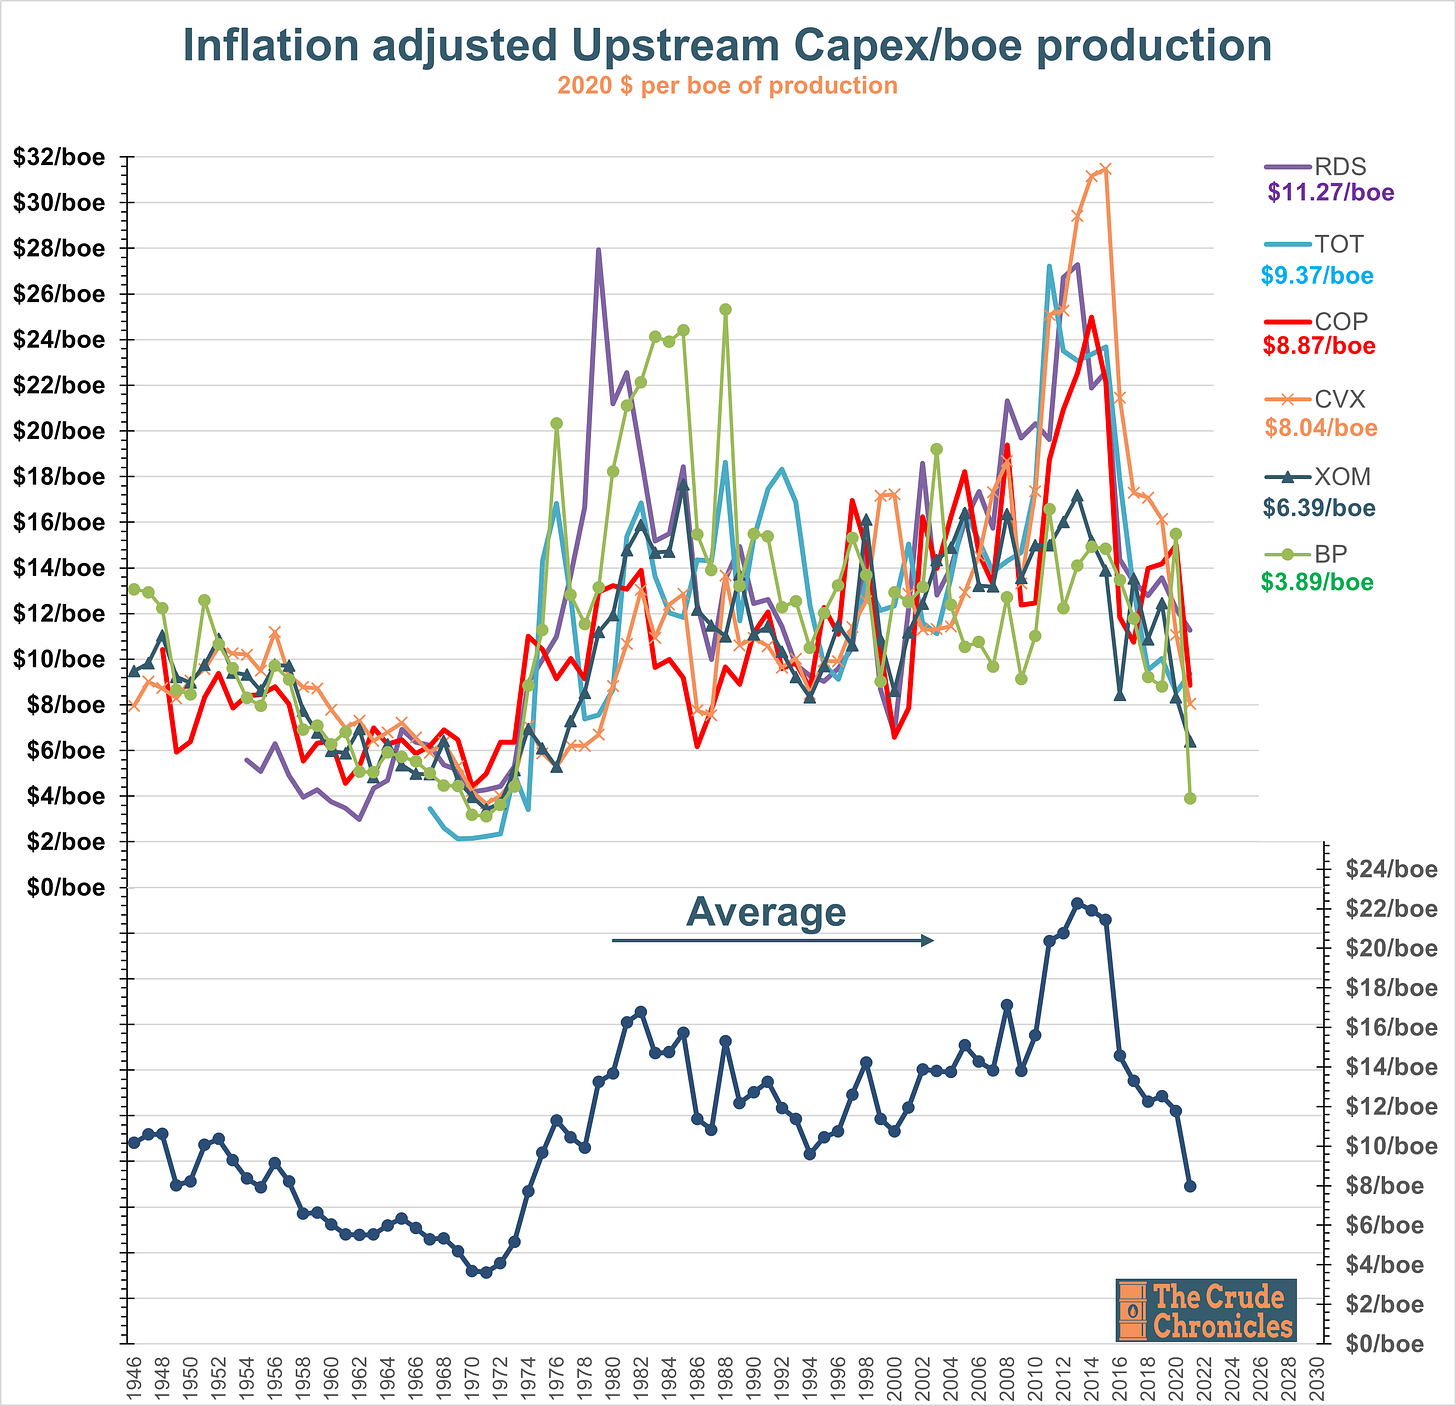
But when divided by level of production we get a better look at capex levels.
That is what this next chart does.
It is inflation adjusted upstream capital spending divided by total production (boe) or real capex spending per boe of production.
The top half is by company, the bottom half is the average of the 6.
$ per boe of production. We are back to 1973/1974 levels.
A lot of takeaways from this chart.
From just after WW2 to 1974, you can see the Seven Sisters (all of which are captured in the current constituents) drove down the capital intensity of production via cheap Middle East and N. Africa production. By 1971, they drove the figure down to $3.61/boe of production.
After 1974, the capital intensity of production increased after they were all nationalized. It climbed from an average of $3.61/boe to $16.77/boe as they moved into the GoM, N. Sea, Alaska, Mexico and other expensive basins.
You can see the last cycle which peaked in 2014 at close to $22/boe.
The average has round tripped back to 1974 levels of ~$8/boe. Things got hairy after 1974 if I recall correctly
Next, let’s jump into some downstream refining charts.
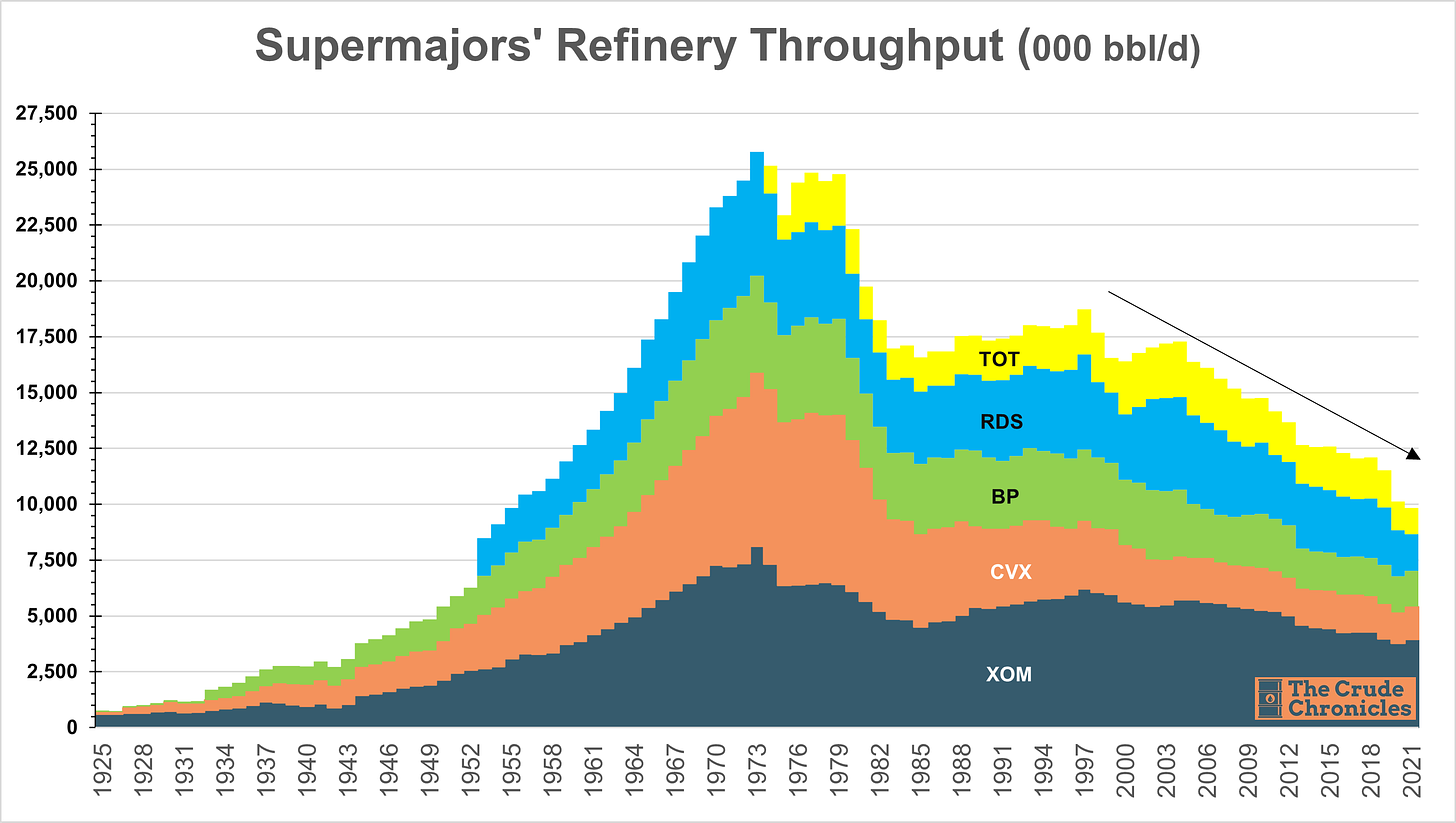
For the most part, upstream production for the supermajors has been flat for ~30 years.
The same can not be said about refining throughput as shown below.
IOCs have become less “integrated” over the years
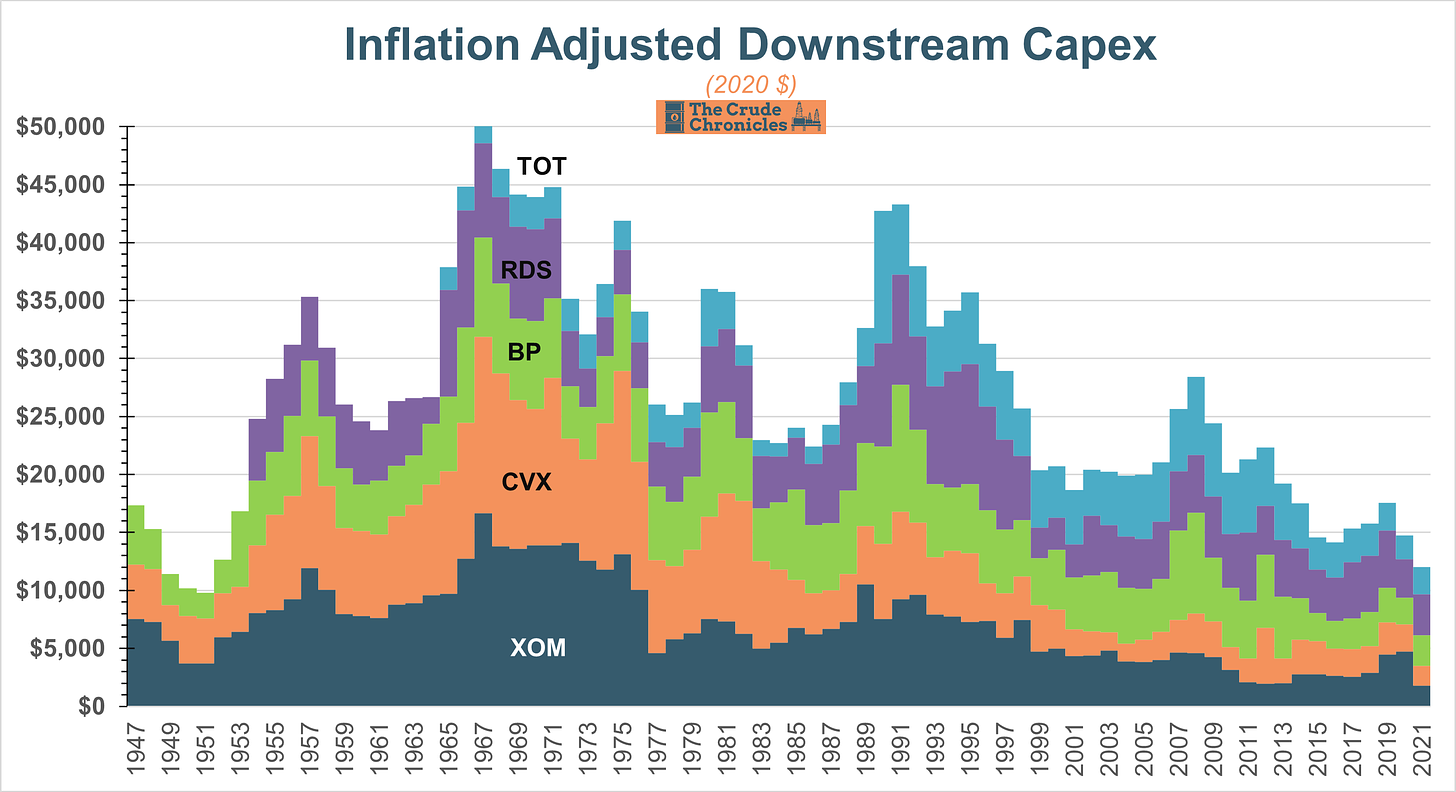
And this can be seen in inflation adjusted downstream capex below. A similar path as throughputs.
Note - I use the Nelson Farrar refinery construction cost index as a deflator.
So downstream capex have fallen in tandem
In the future I am going to add the PSX/COP downstream history to these charts.
The next chart divides real downstream capex by throughput. Similar to the earlier chart, individual companies are on top and the average of the 5 is on the bottom.
Downstream capex is low for CVX but high for RDS, TOT and BP.
The average of the 5 is not stretched vs history.
$ of capex per bbl of throughput is not as depressed as upstream
Hope you enjoyed this first edition of my capex report.
Now let me ask you for a favor.
If you loved the content, please share
If you like the content, please subscribe
If you have some thoughts/opinions, leave a comment
Or option D, do none of the above and just stay tuned!
Disclaimer
I certify that these are my personal views at the time of this writing. I am not paid or compensated for any of my content. And above all else, this IS NOT an investment newsletter and there is no explicit or implicit financial advice provided here. My views can and will change in the future as warranted by updated analyses and developments. As you may have noticed, I make comments for entertainment purposes as well.
The Crude Chronicler




Excellent. As an old, now retired contrarian analyst, I am truly appreciative of your effort.
Yet given my now restricted life expectancy and hyper pessimistic outlook, my focus and portfolio is totally dedicated to PMs.
But I relayed your piece to younger and more knowledgeable friends.
I mean, capex/BoE should go down with technology. I agree overall absolute capex should keep increasing with inflation and more oil.