Welcome back Chronicle Crew.
In business, we look for end markets and products that have scalability - products and services that can add incrementally more dollars to the topline with little to no additional cost.
For content creators, nothing is more magical than being able to create 1, 2, 3 or more pieces of content with just one topic or in my case, a dataset.
What’s the point of this dialogue?
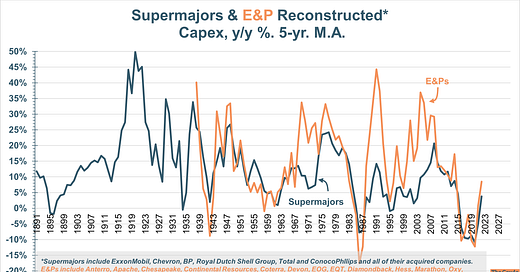
Last year I published what is hands down my most popular post to date - A history of the Supermajors Capex Cycles (HERE).
This week’s post is the annual update but with E&Ps and their historical data added.
As always I include data from acquired companies.
Input one more year of data then pull the chart down through 2022 and voila!
Scalability!
Note: there is a large piece of the picture that is missing from these charts and that is of the national oil companies. In talking with some very smart and intelligent people a few months ago, it is my number 1 objective to try and gather this data when/if it is available.
I hope you enjoy!
On a 5-yr smooth basis, capex growth rates were back above zero for the first time since 2015. This is quite a shift in the narrative.
Keep reading with a 7-day free trial
Subscribe to The Crude Chronicles to keep reading this post and get 7 days of free access to the full post archives.


