


Less ESG, More ROCE - 2024 Integrated O&G Compensation Review.

The Gist (1) Relative profit growth and returns on capital in excess of the cost of capital, i.e., value creation, drive integrated O&G returns and valuation. (2) Use this pullback in energy to ditch ESG centric KPIs within management compensation structures and lean more into metrics that tie to shareholder returns ie profits and value creation. (3) I present a real-time case study of BP and the changes currently underway.
Programming Note: I'm releasing this post a day early ahead of the Memorial Day weekend—I'm guessing many of you will be stepping out of the office a bit early to kick off the summer, and we will be too. As a result, the next post will be out next week on the 30th.
Point #1: Relative profit growth and returns on capital in excess of the cost of capital, i.e., value creation, drive integrated O&G returns and valuation.
The foundational chart that underpins long-term investors’ thinking in the energy sector dates back to the days of Standard Oil. It shows that sustained returns on capital—whether ROCE, ROIC, or others—in excess of the cost of capital (WACC) are what truly drive valuation levels over time.
Below, we see ExxonMobil’s record since 1912.

As well as Chevron.
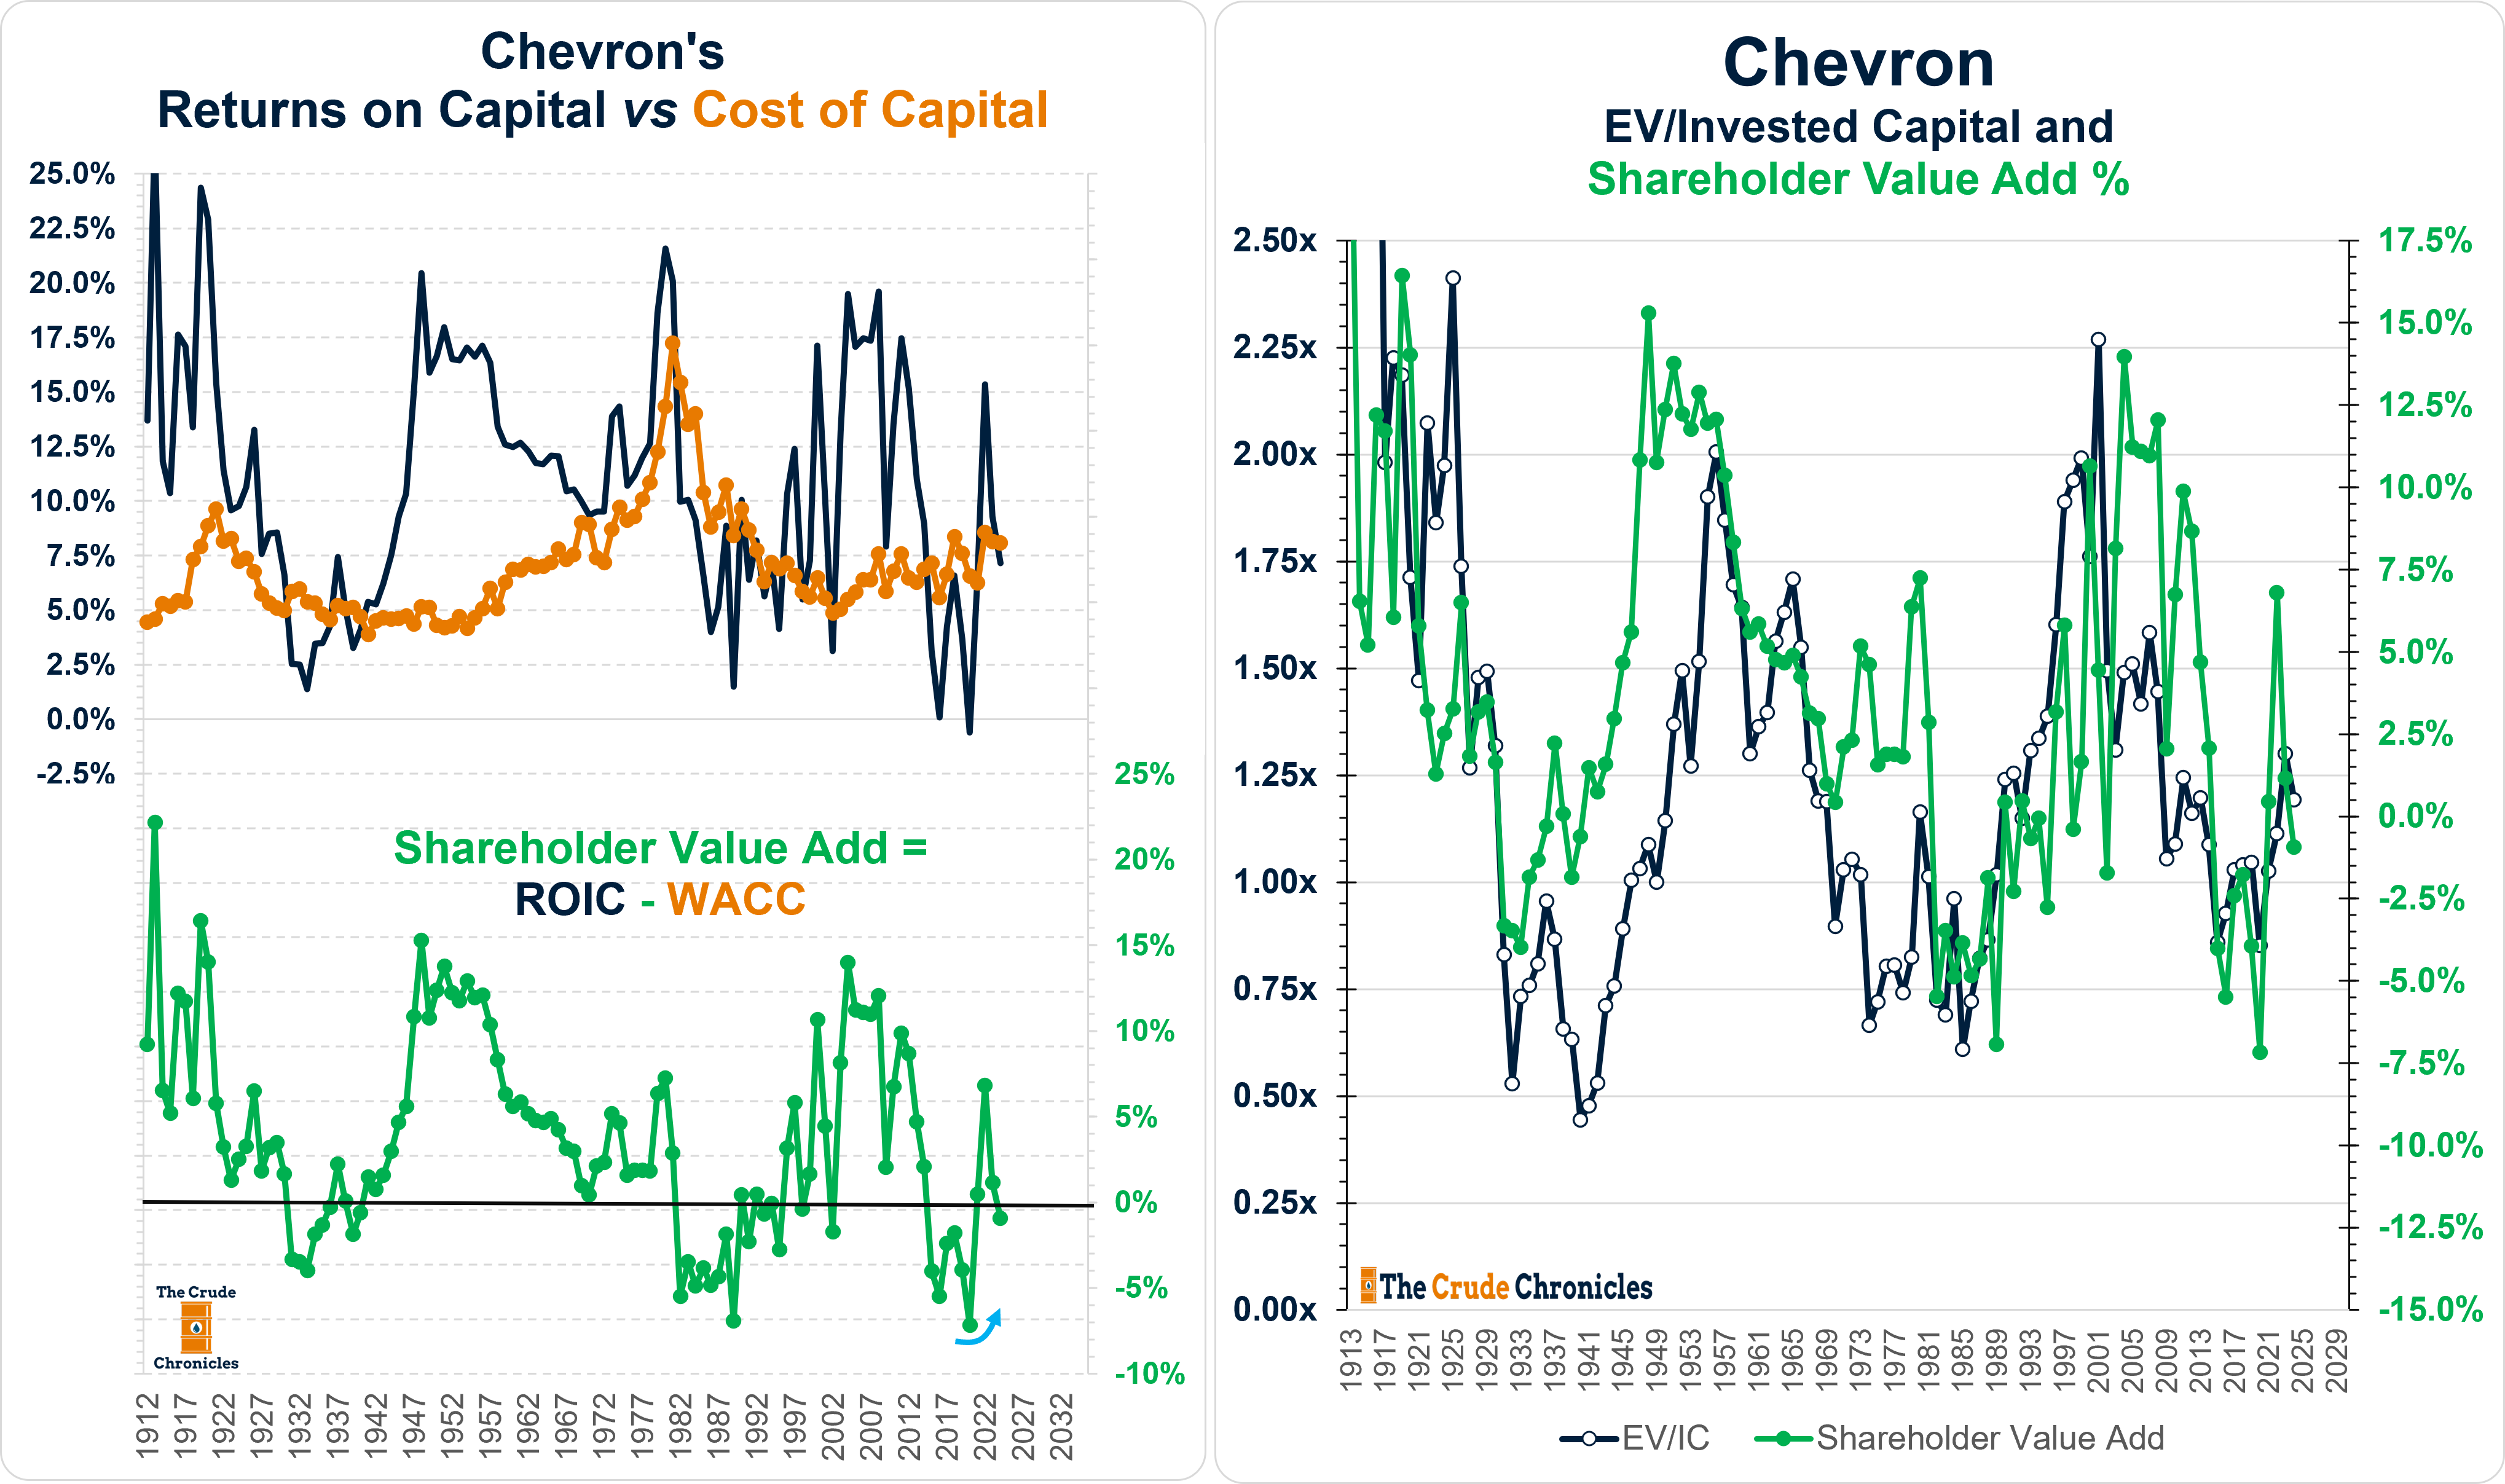
Even the founder of it all—John D. Rockefeller’s Standard Oil Trust—was valued based on its ability to create value.

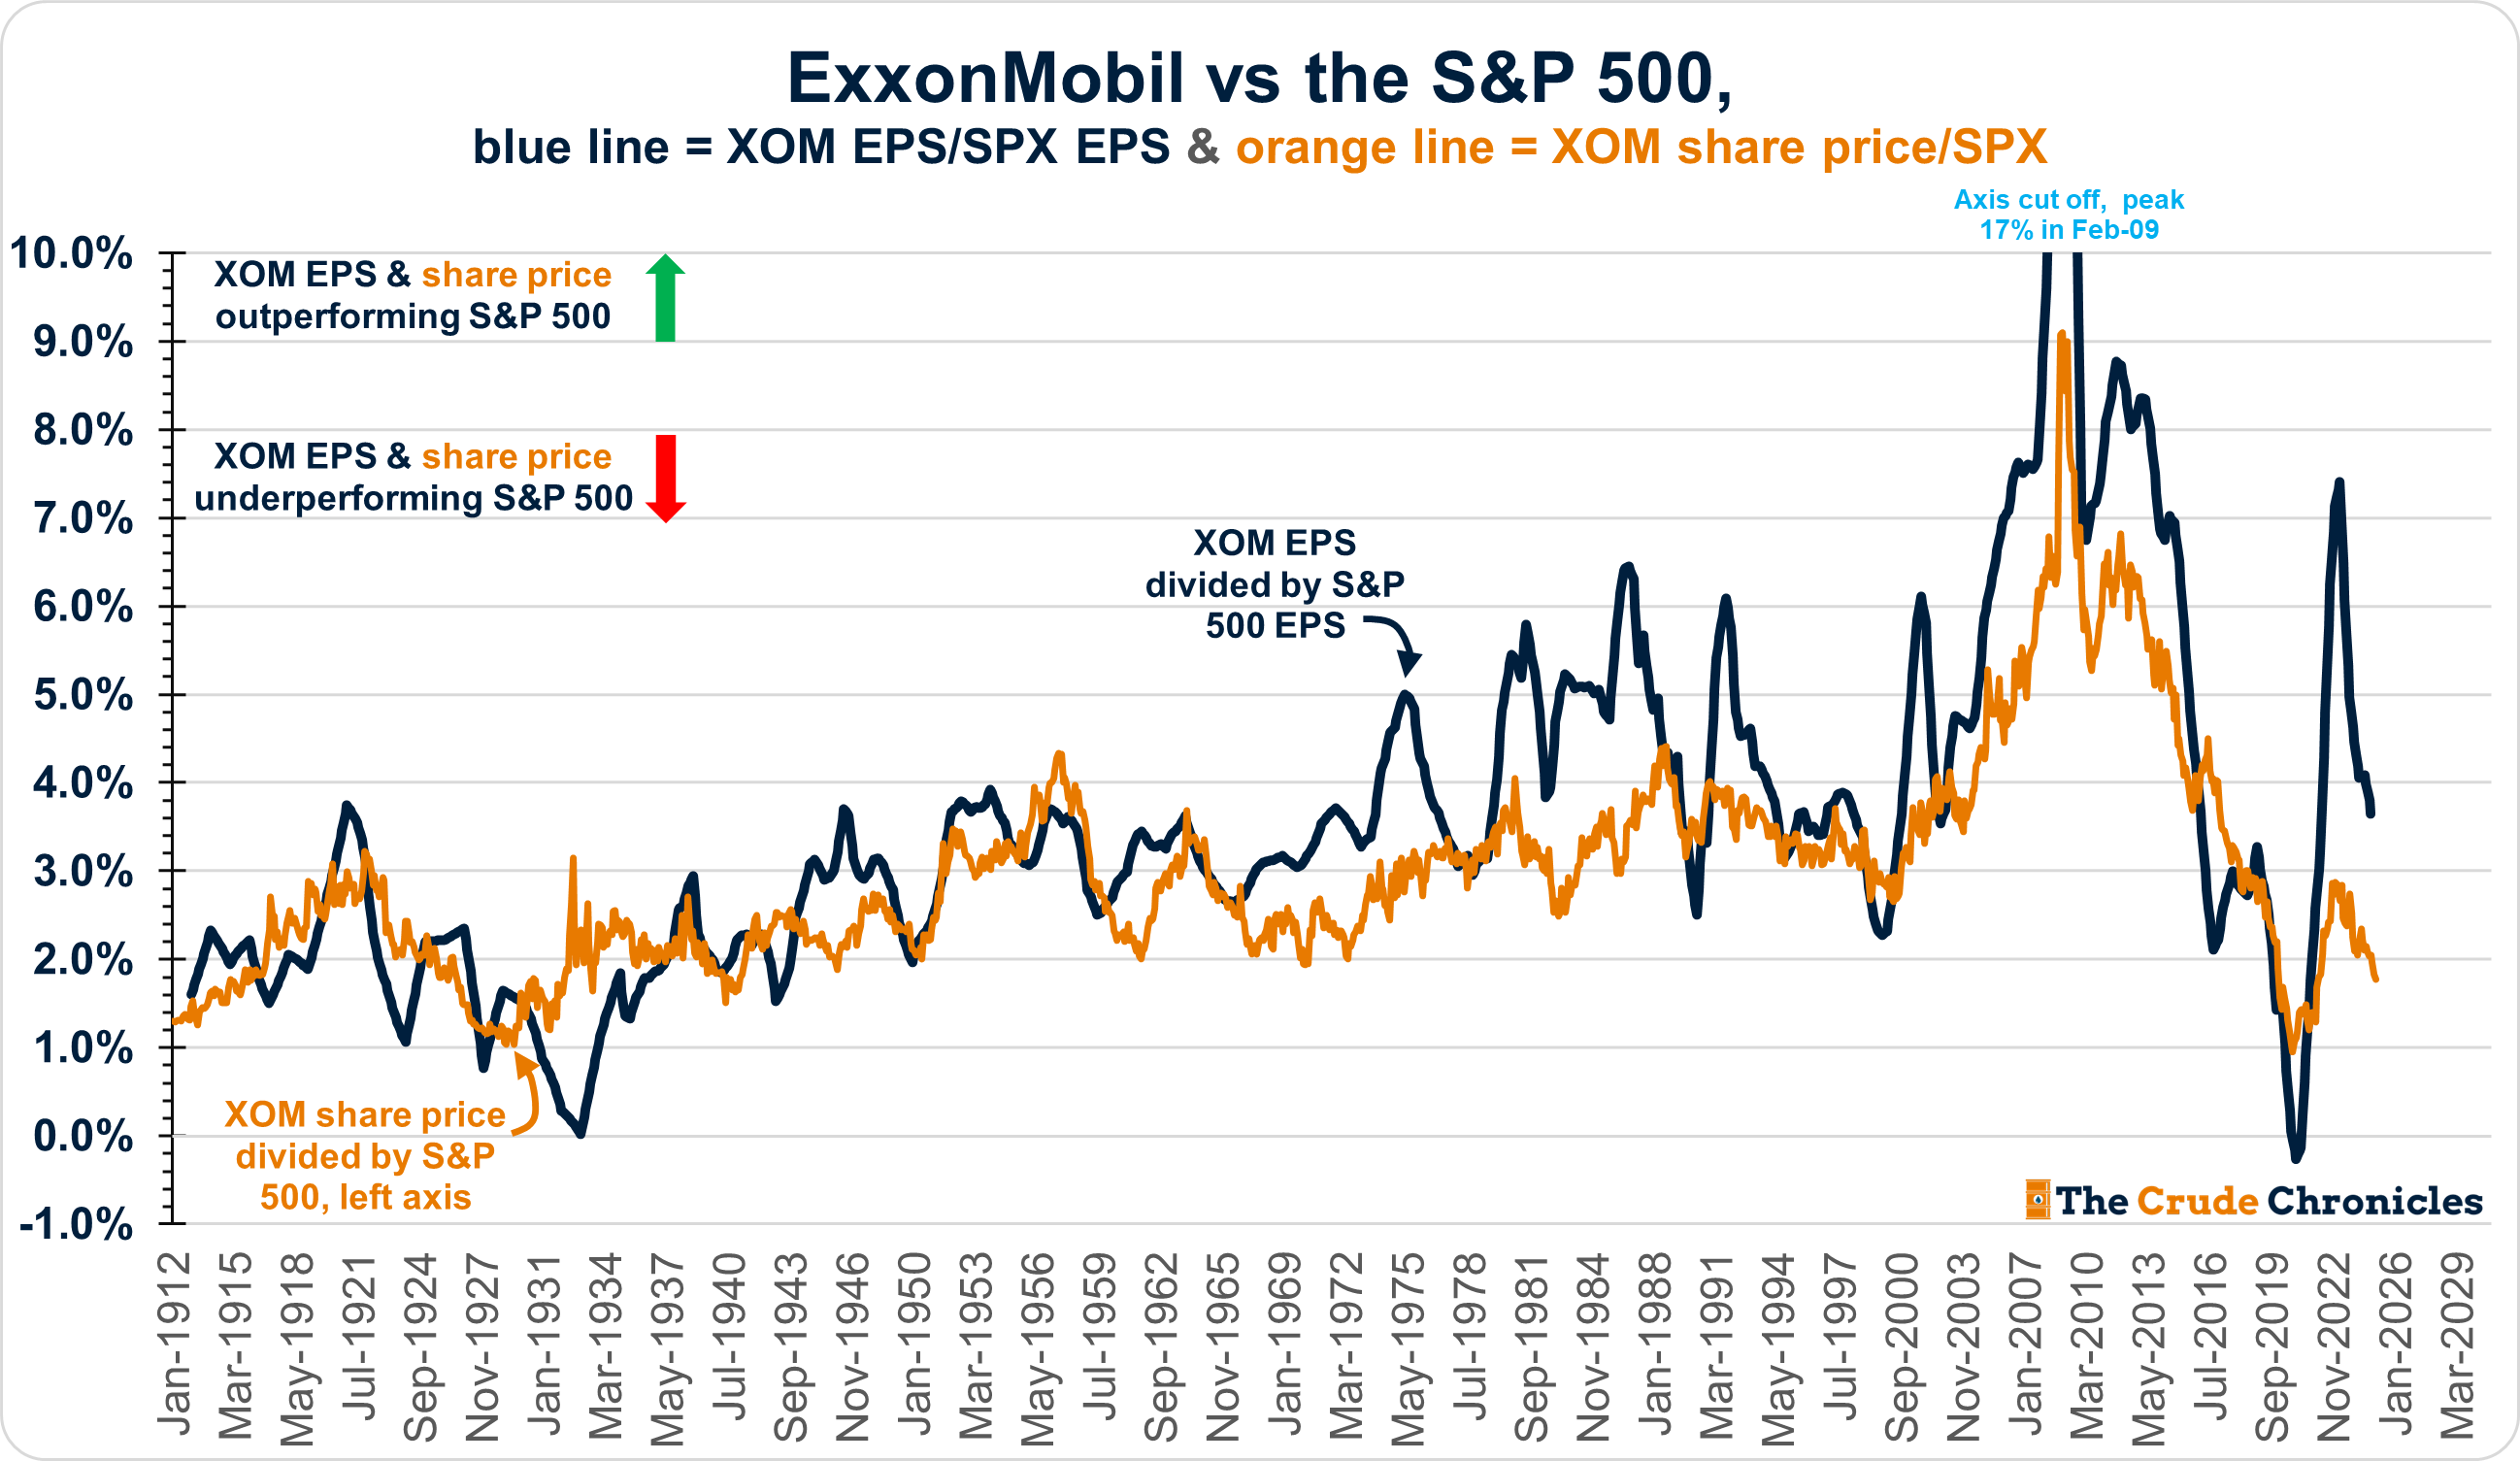
And since profit growth is the numerator in the return on capital equation, it's no surprise that it also drives long-term relative performance.
ExxonMobil vs. the S&P 500 with monthly data back to 1912.
Chevron vs. the S&P 500 with monthly data over the same period.
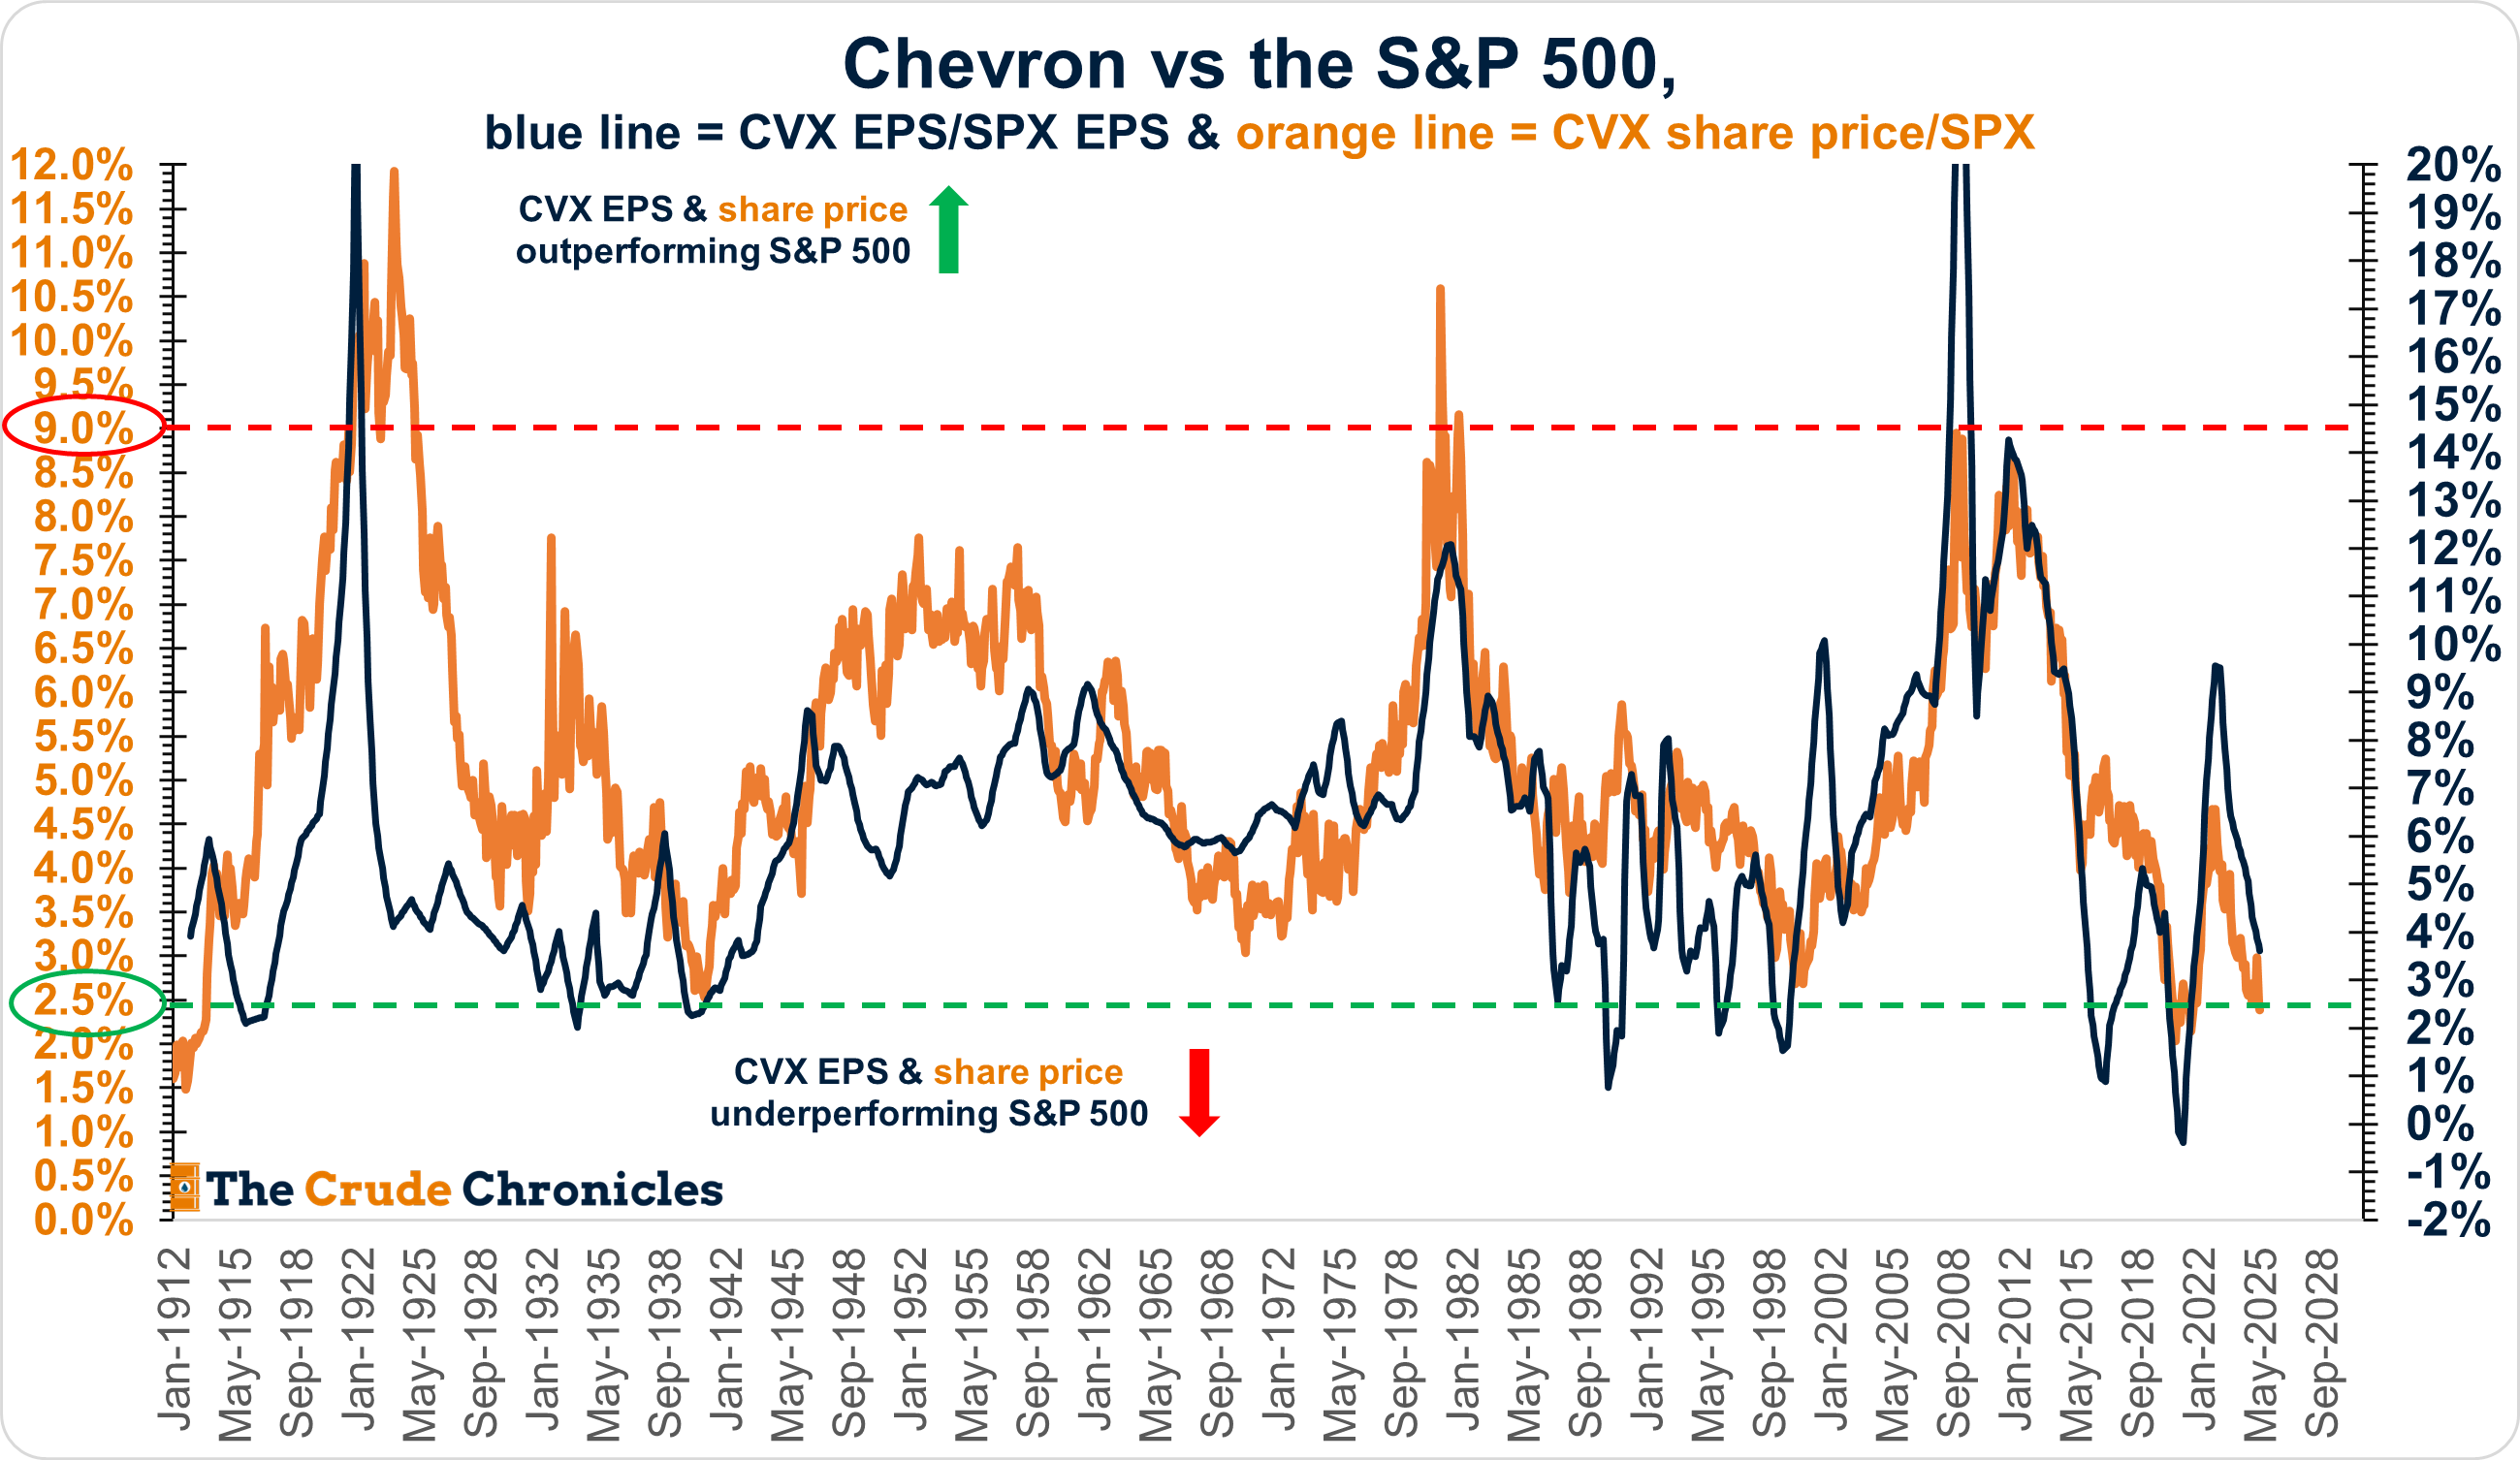
The data is clear: profit metrics and more importantly, value creation measures like ROCE and ROIC vs the cost of capital—are the real engines behind long-term performance in the integrated oil & gas sector. These are the metrics that correlate with shareholder and valuation levels and should form the foundation of executive compensation.
To be blunt, anything else is just noise.
That said, safety metrics remain the rightful exception—operational safety is non-negotiable.
So here’s the simple takeaway of this post:
This pullback in energy prices presents an opportunity for the integrated oil & gas names to emphasize value creation and profit metrics even more. It’s time to ditch ESG-centric KPIs within management compensation packages and lean further into value-based metrics.
Let’s dig into it.
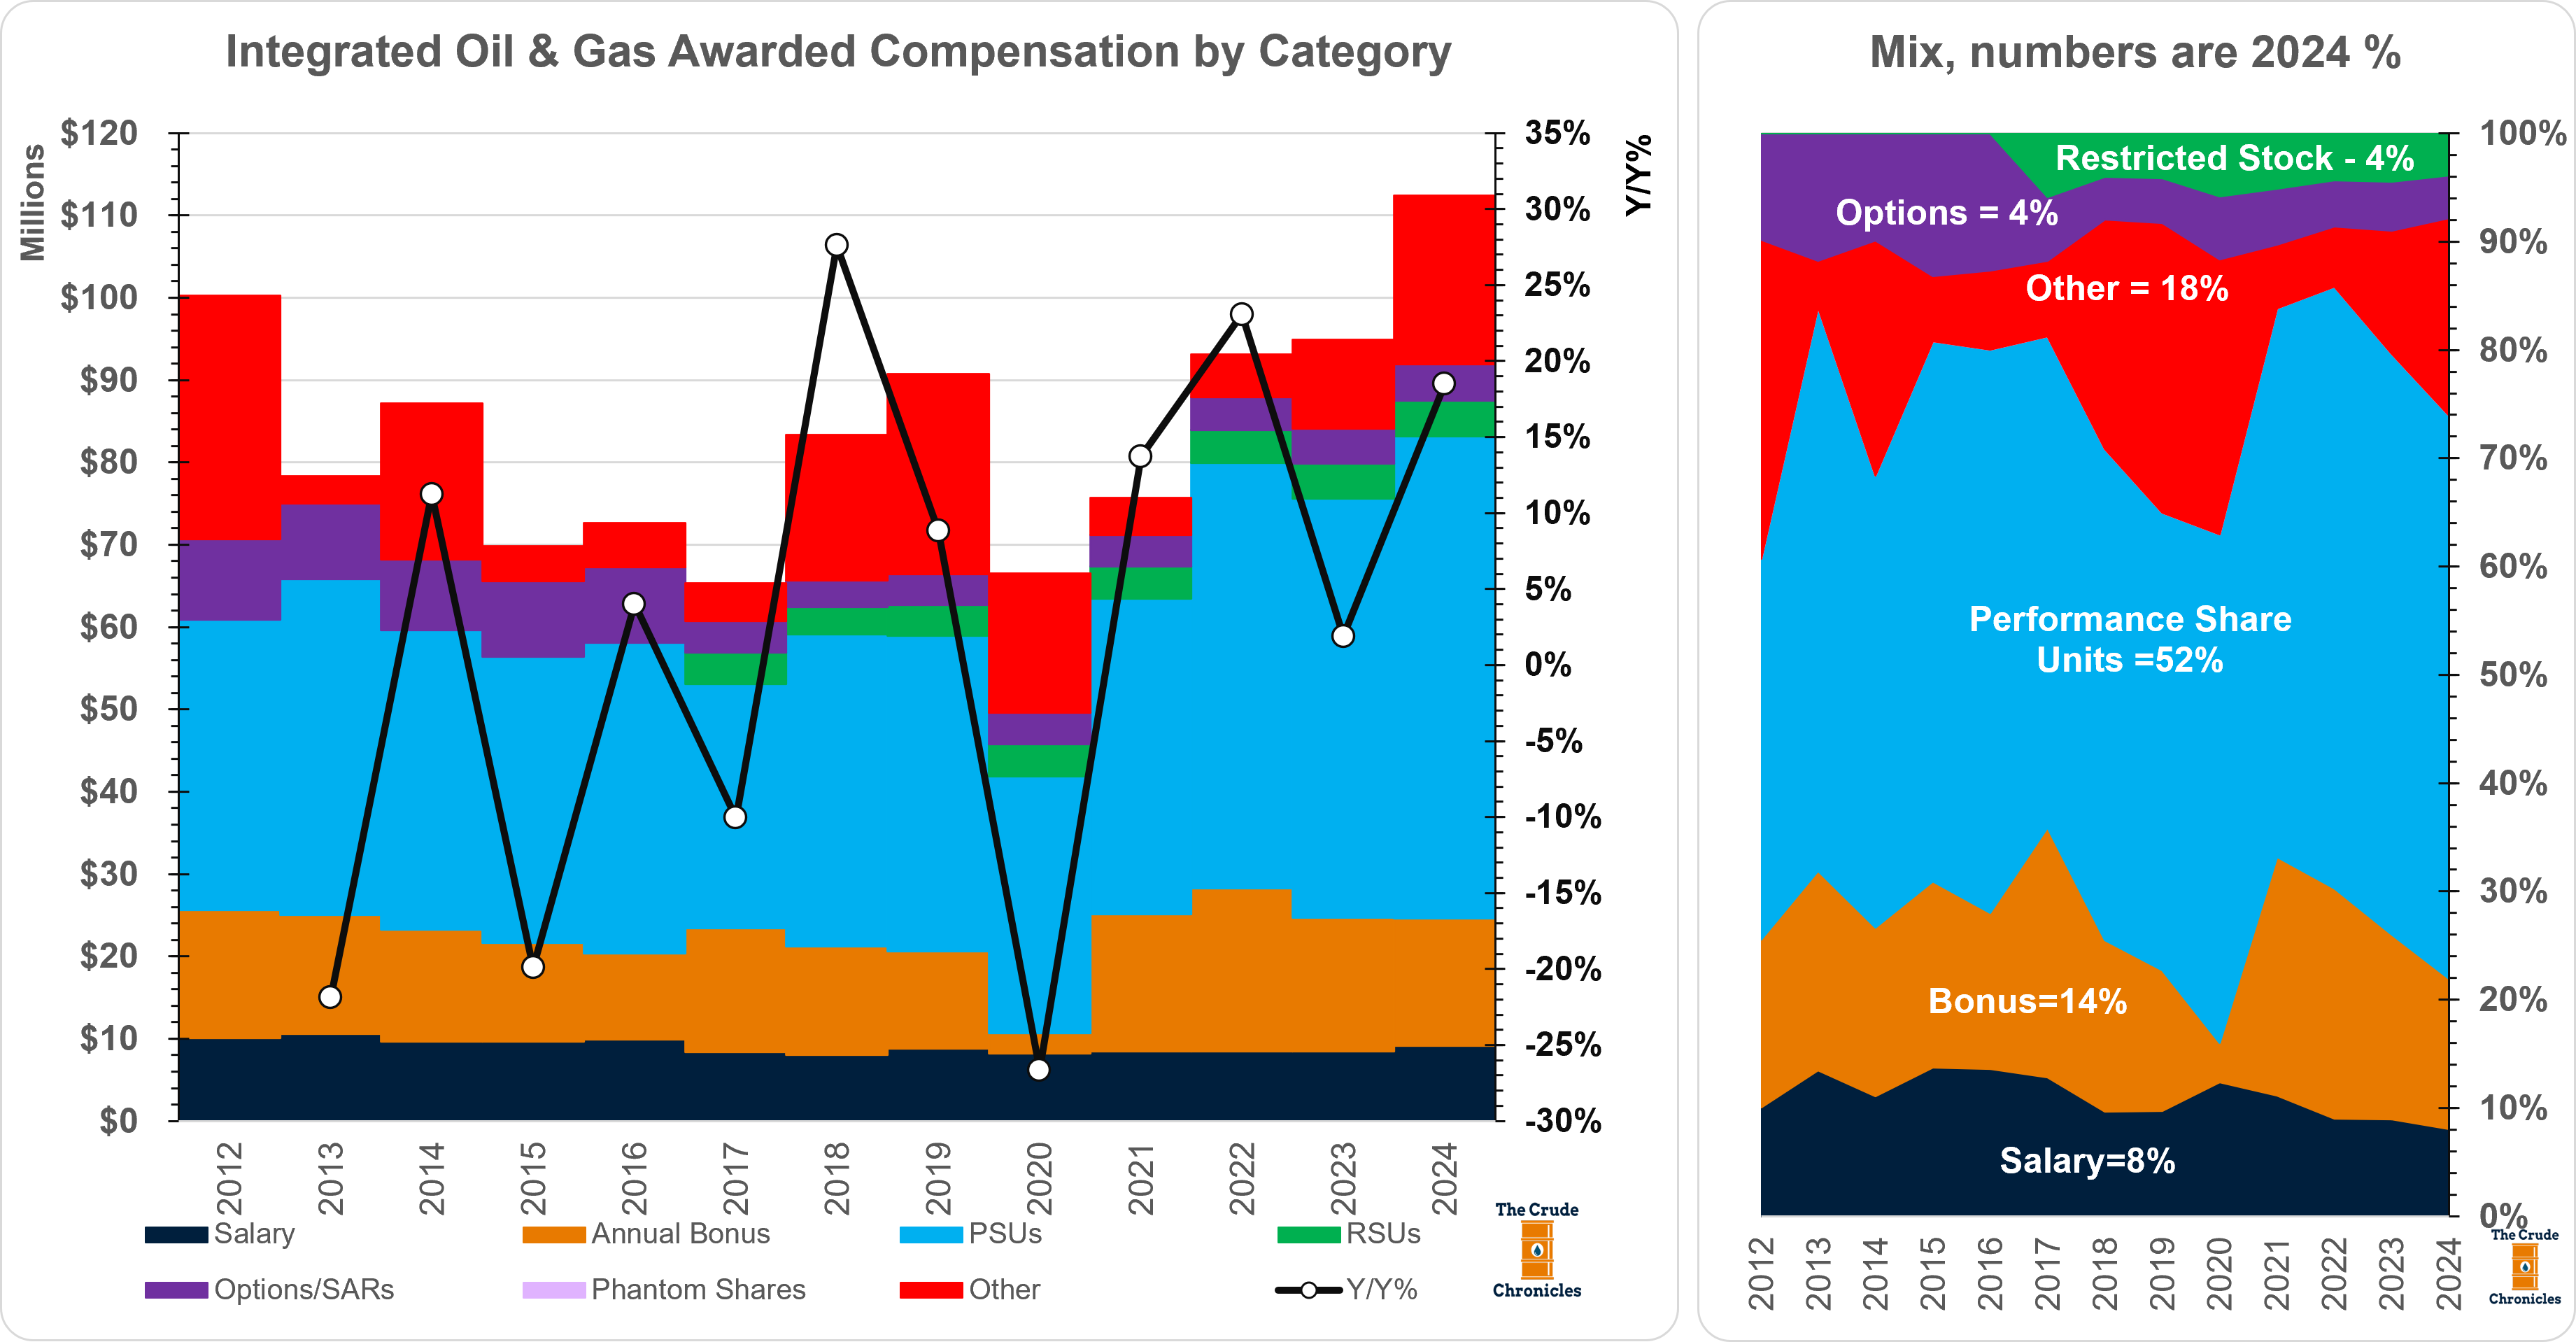
Aggregating the Summary Compensation Tables from the 2024 Annual Proxies and 20-Fs shows that awarded compensation increased by approximately 18.5% year-over-year.
However, awarded compensation isn’t the same as realized compensation, given the vesting restrictions and performance hurdles tied to long-term incentive (LTI) instruments so below I present realized compensation which includes salaries, annual incentive bonuses as well as exercised options and vesting stock. It’s more representative of take home pay.

The line in the chart represents the three-year smoothed average of total shareholder return (TSR), which includes both price appreciation and dividends of the represented group.
Broadly speaking, when the stacked bars (realized compensation) and the TSR line move in tandem, it signals alignment between shareholder outcomes and management incentives—or pay-for-performance.
A company-by-company breakdown follows below.
Keep reading with a 7-day free trial
Subscribe to The Crude Chronicles to keep reading this post and get 7 days of free access to the full post archives.