
Supplying the Demand.

For decades, BP’s Statistical Review of World Energy has been the industry’s gold standard for historical energy data. Today, that responsibility has passed to the Energy Institute (HERE), but for anyone studying the long-term history of oil & gas, it remains a valuable data set that continues to be updated annually.
I was introduced to it early in my career but back then, the investment thesis was very much demand driven.
China was industrializing at a breathtaking pace. Hundreds of millions of people were entering the middle class, urbanizing and raising their living standards and as China’s oil consumption per capita converged toward the global average, it would require millions of additional barrels of supply.
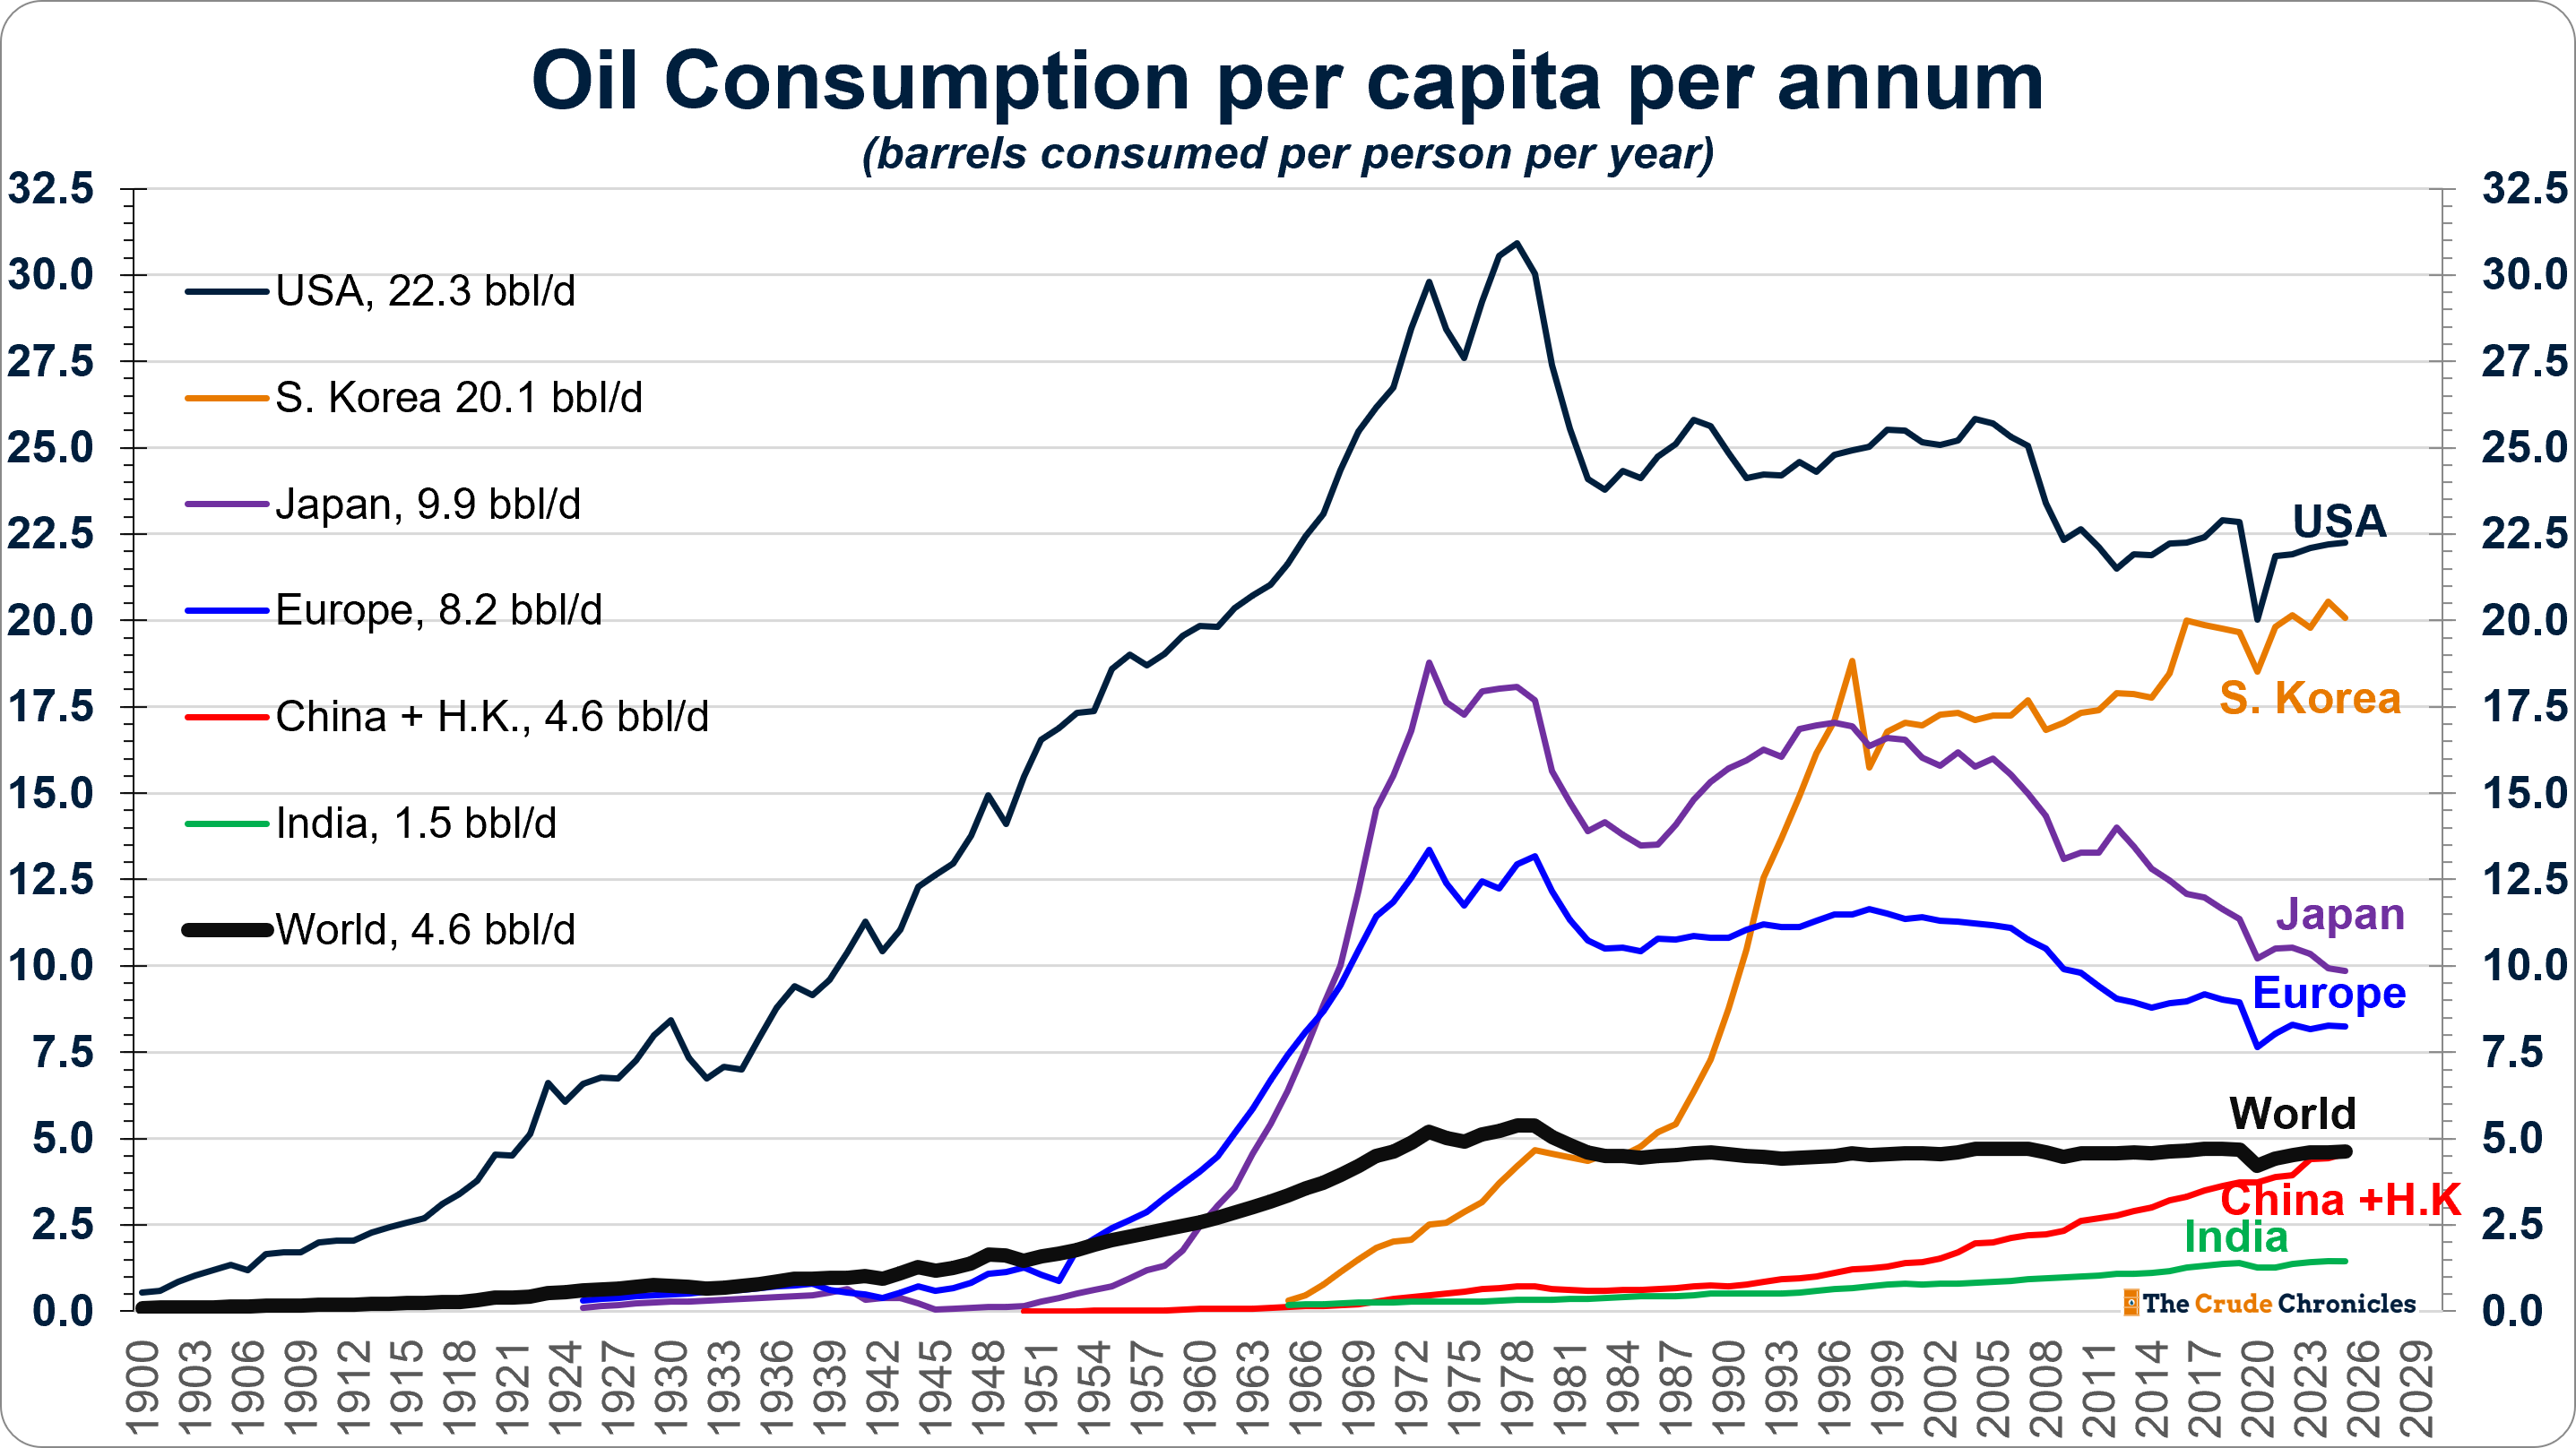
It’s been a quarter century since I first saw a version of the chart above. For the first time, in 2025, the little red line representing China finally converged with the rest of the world, reaching 4.6 barrels per person per year.
Few could have anticipated it at the time, but the supply response that enabled such extraordinary demand growth—particularly from U.S. shale—has been nothing short of remarkable. That said, we shouldn’t overlook the contributions of other major producers, including Russia and Saudi Arabia (HERE) along with smaller, yet still meaningful, contributors such as Brazil.
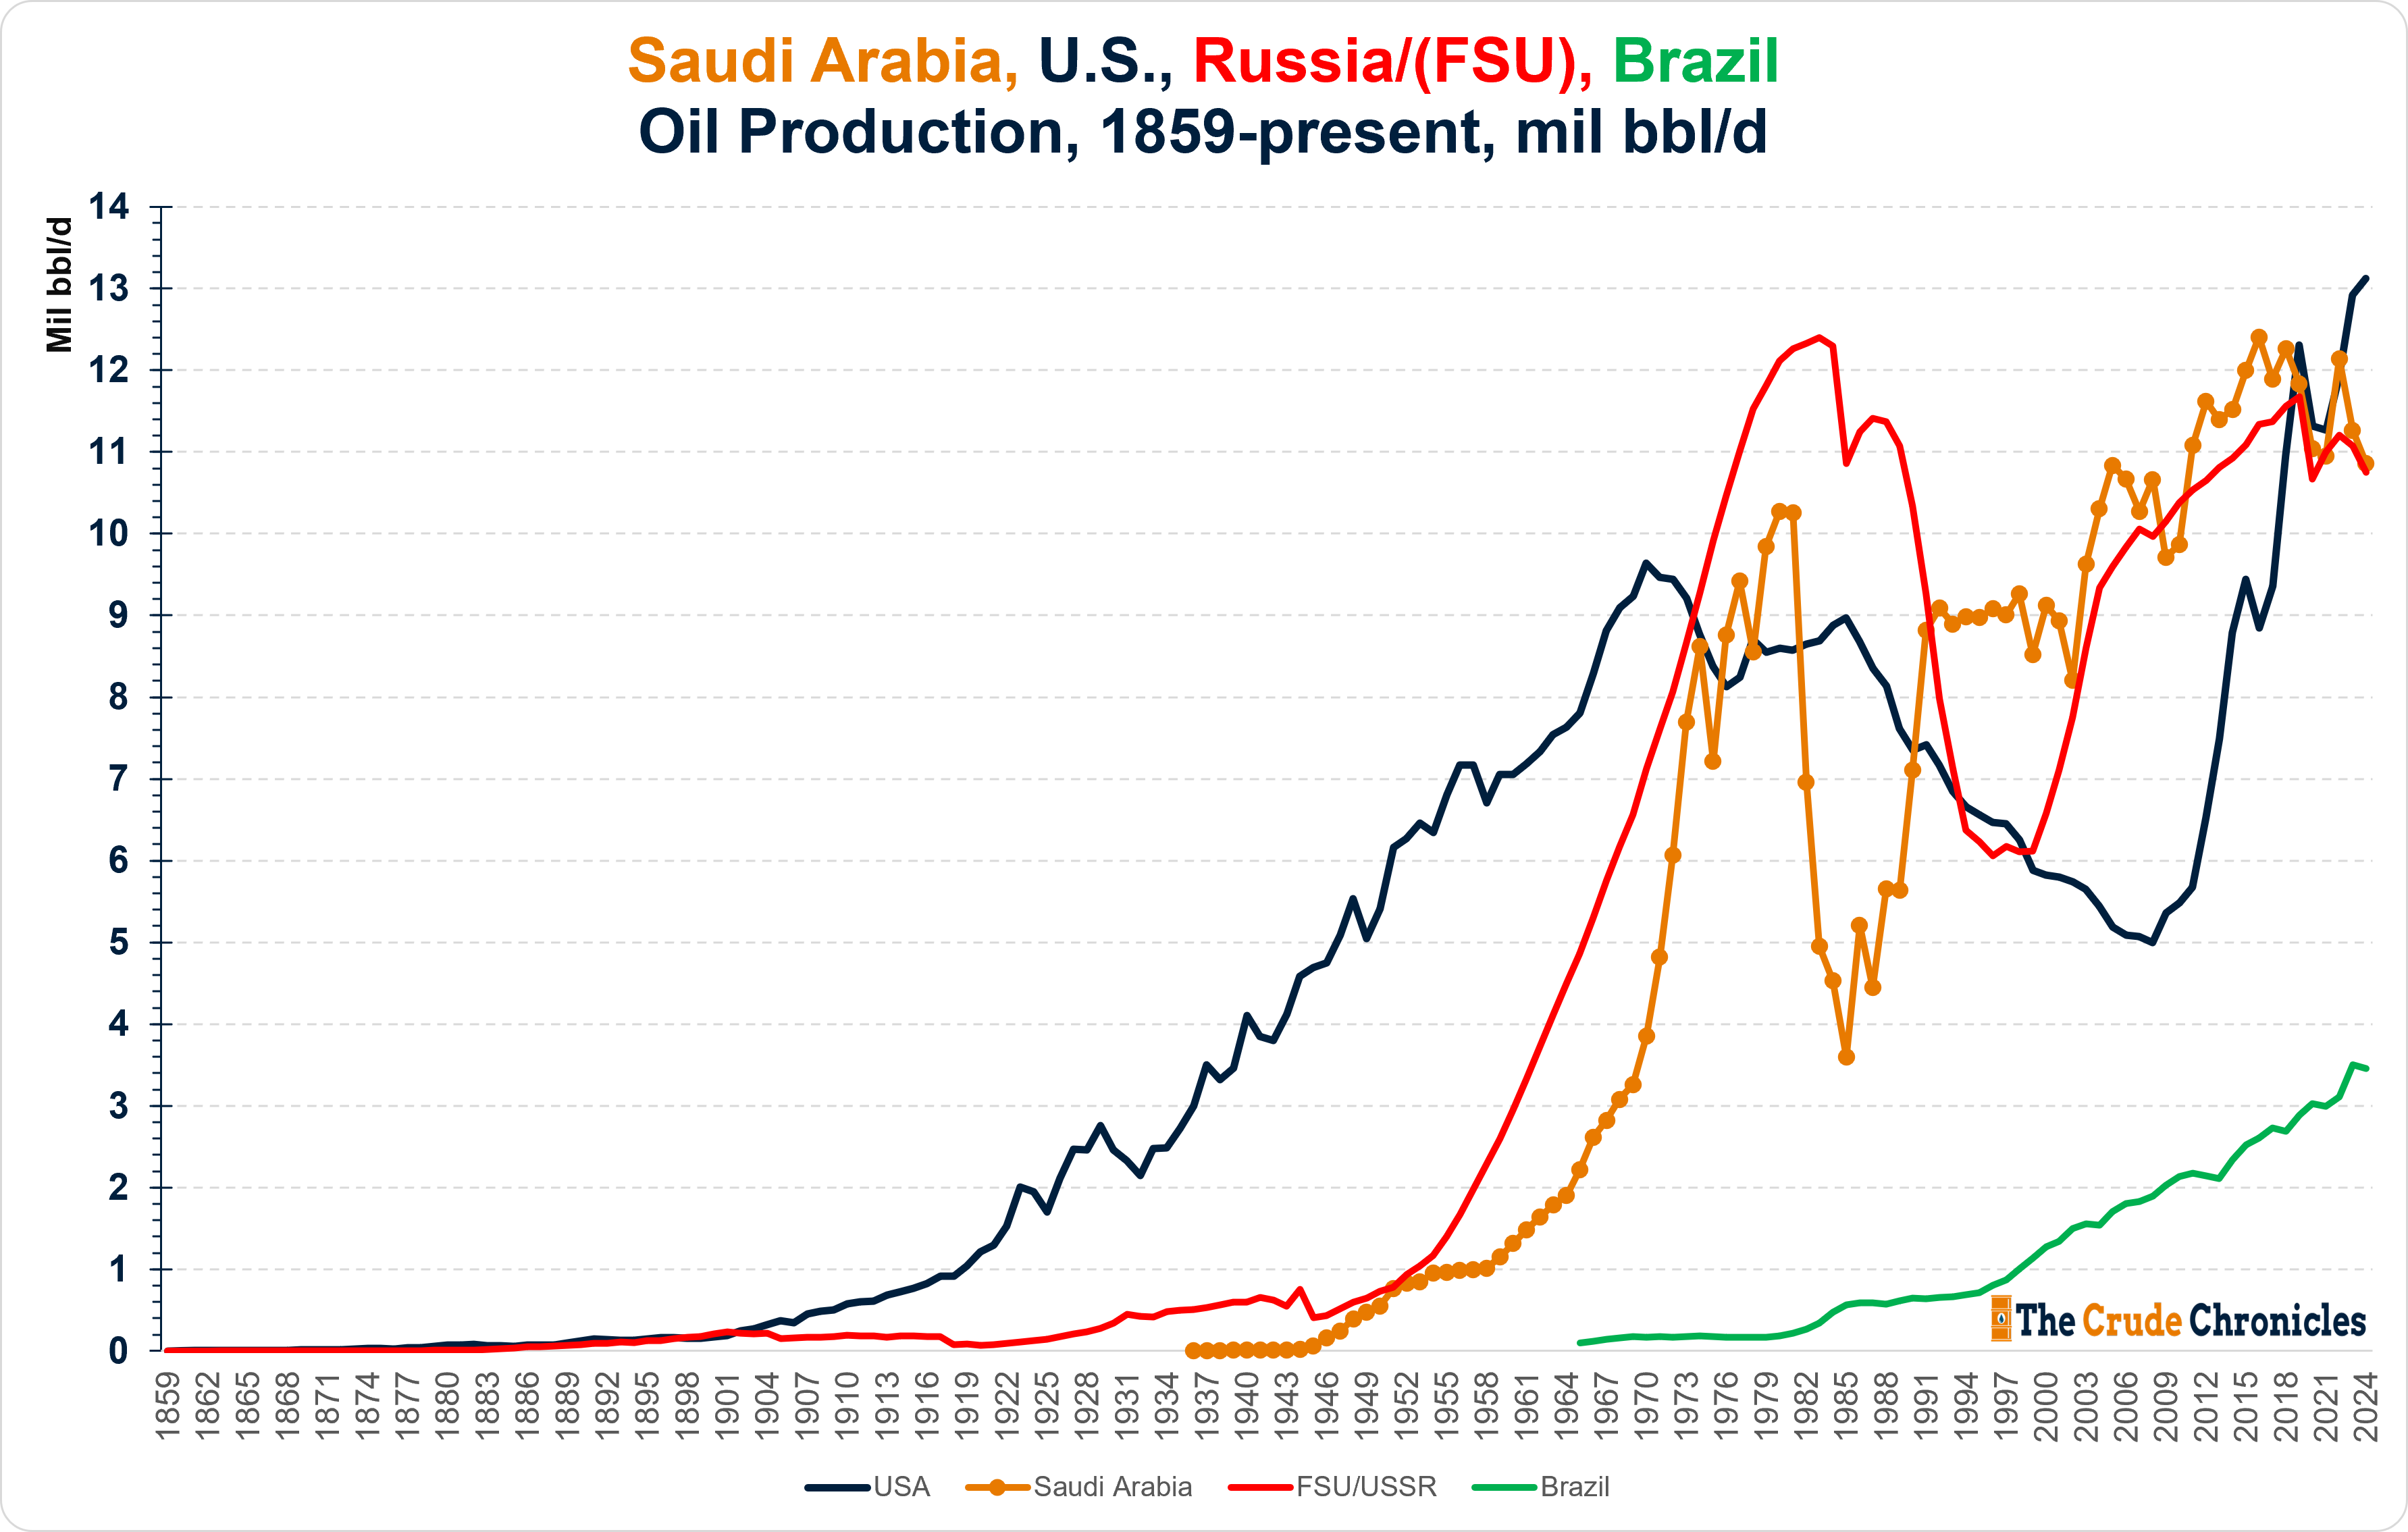
It goes to show you that no matter what will come of demand, supply will rise to the occasion.
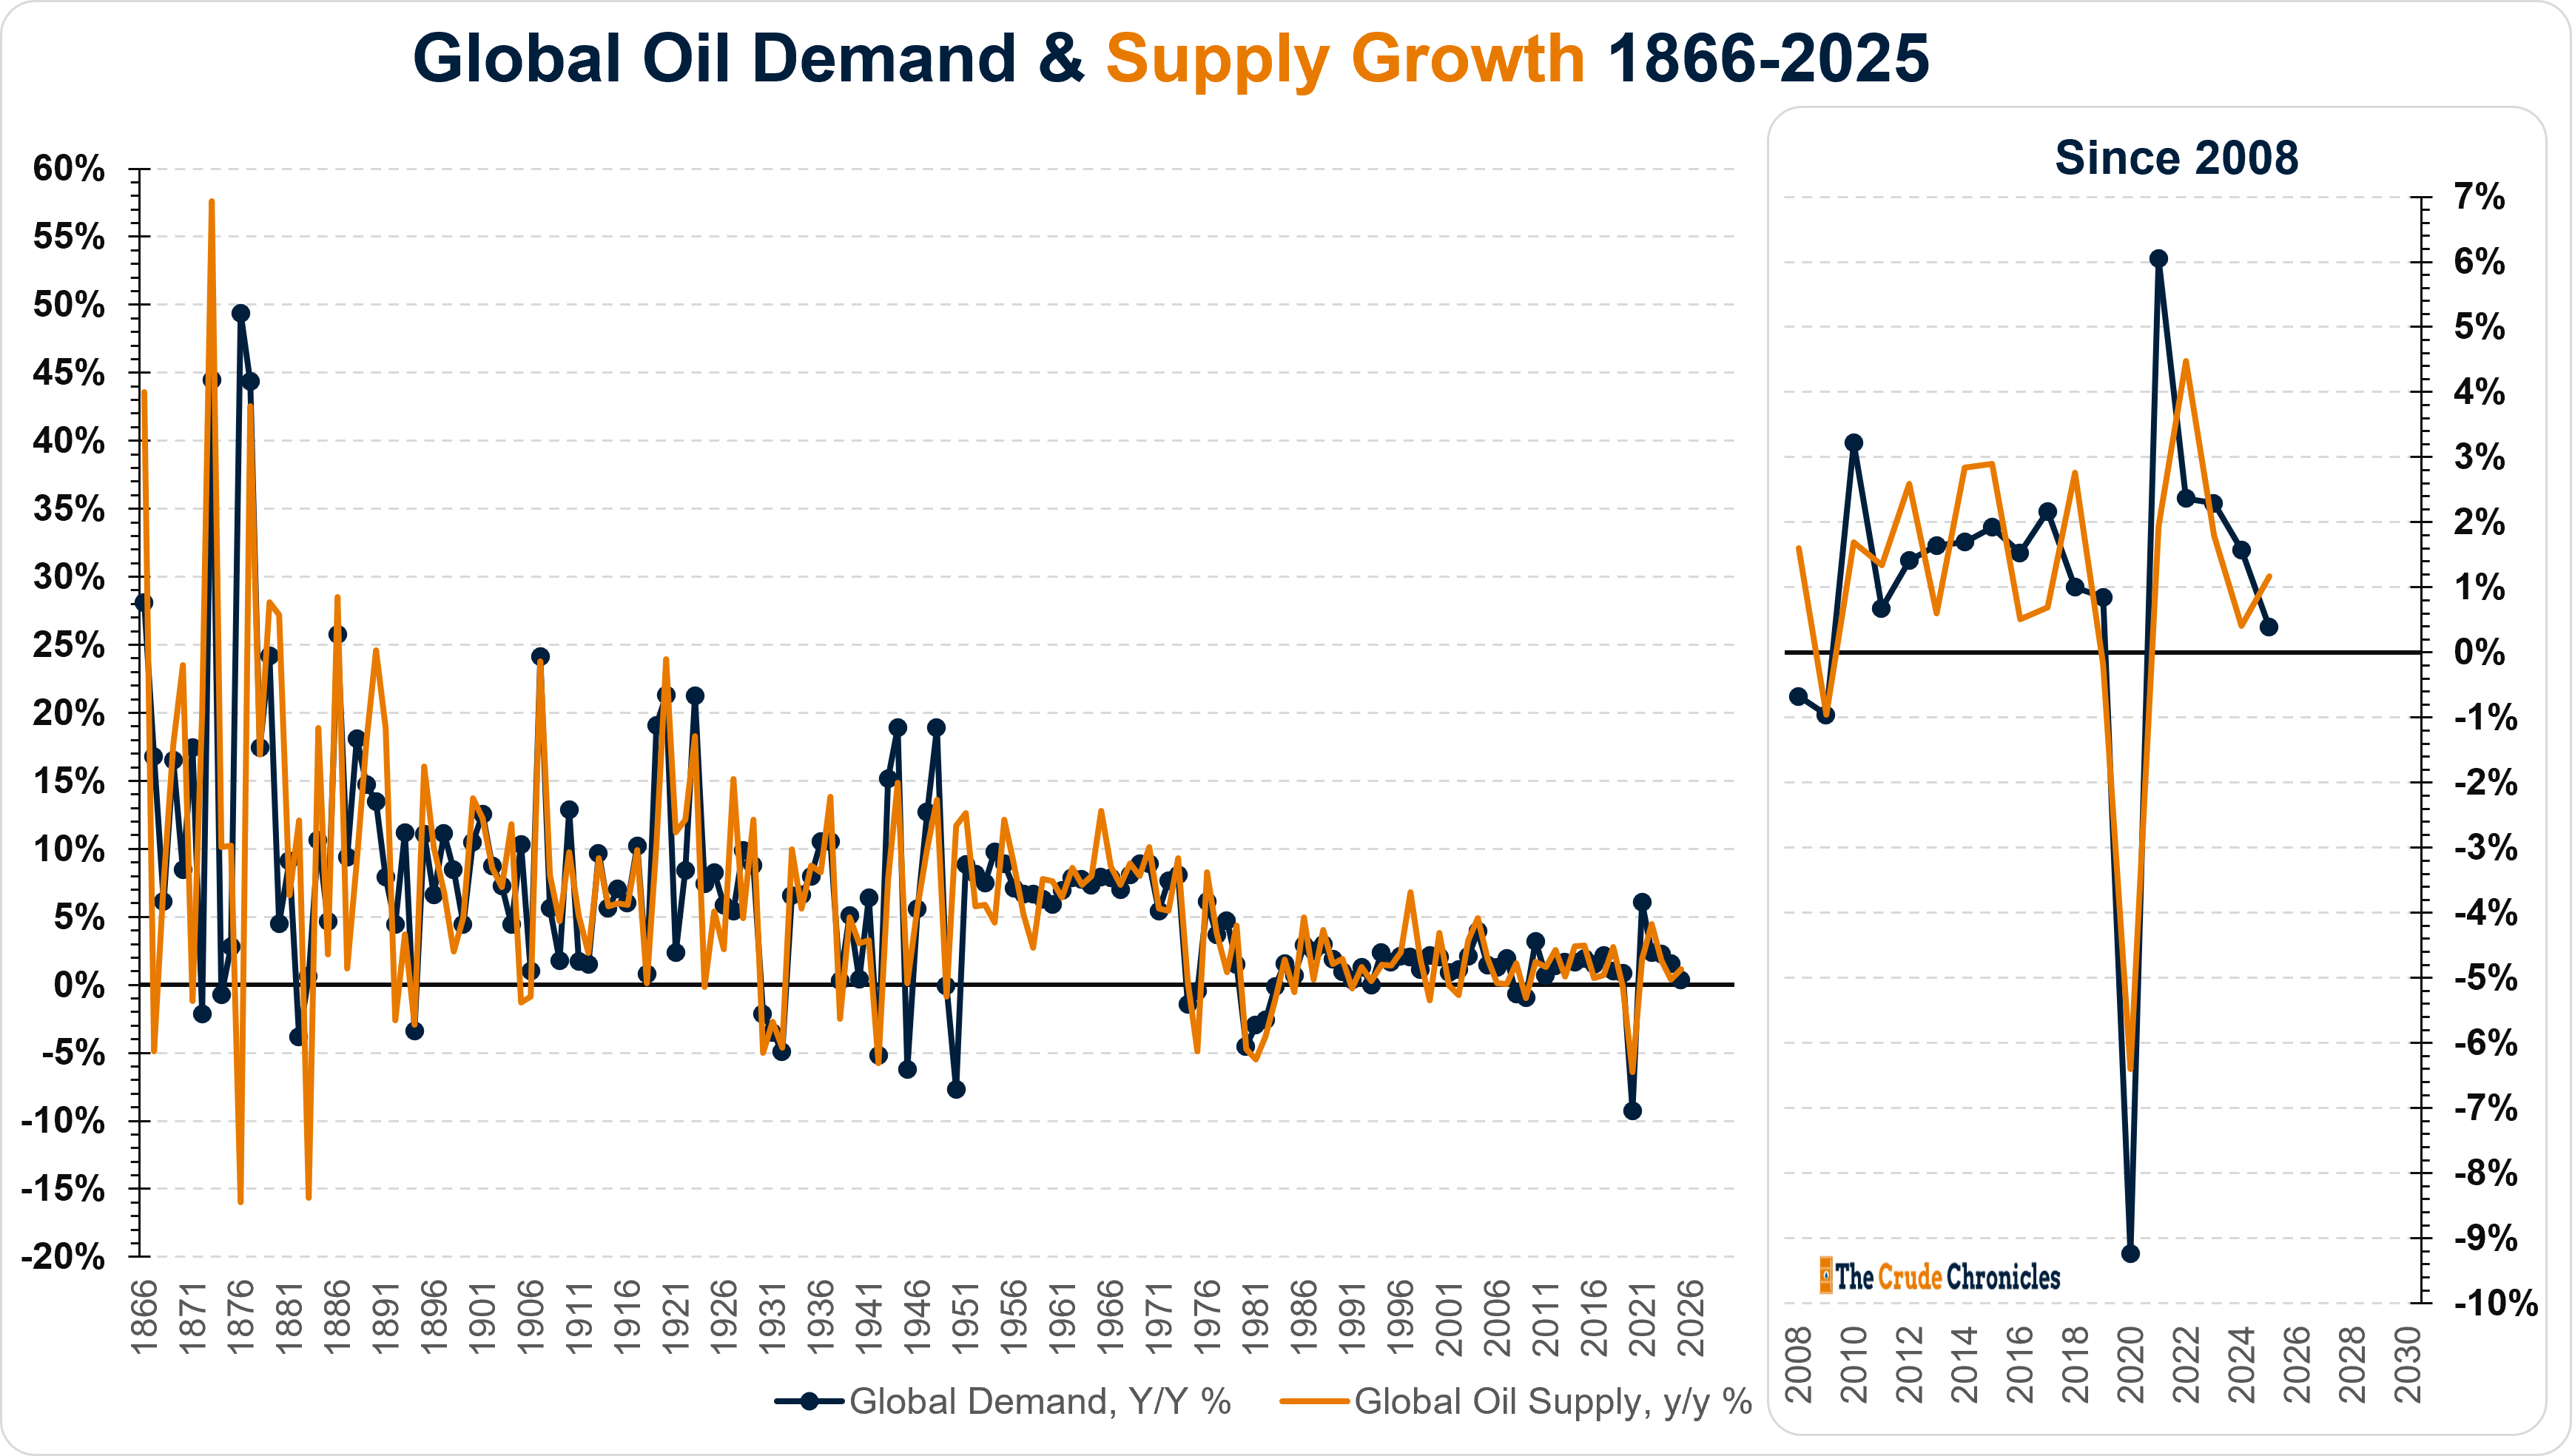
This leads to one of the great misconceptions in oil markets is that bull markets are driven by demand persistently outpacing supply, while bear markets are the result of supply overwhelming demand. History suggests otherwise. Whether oil prices are rising or falling, supply and demand tend to grow together.
Another common misconception is that demographics determine oil demand. China is often at the center of this argument. Yet history tells a different story. Population growth alone has never been a reliable predictor of global oil consumption. Rather, it is productivity—or output per worker—that drives incomes, increases consumption per capita, and ultimately fuels oil demand. Unlike demographics, however, productivity is far more difficult to forecast.
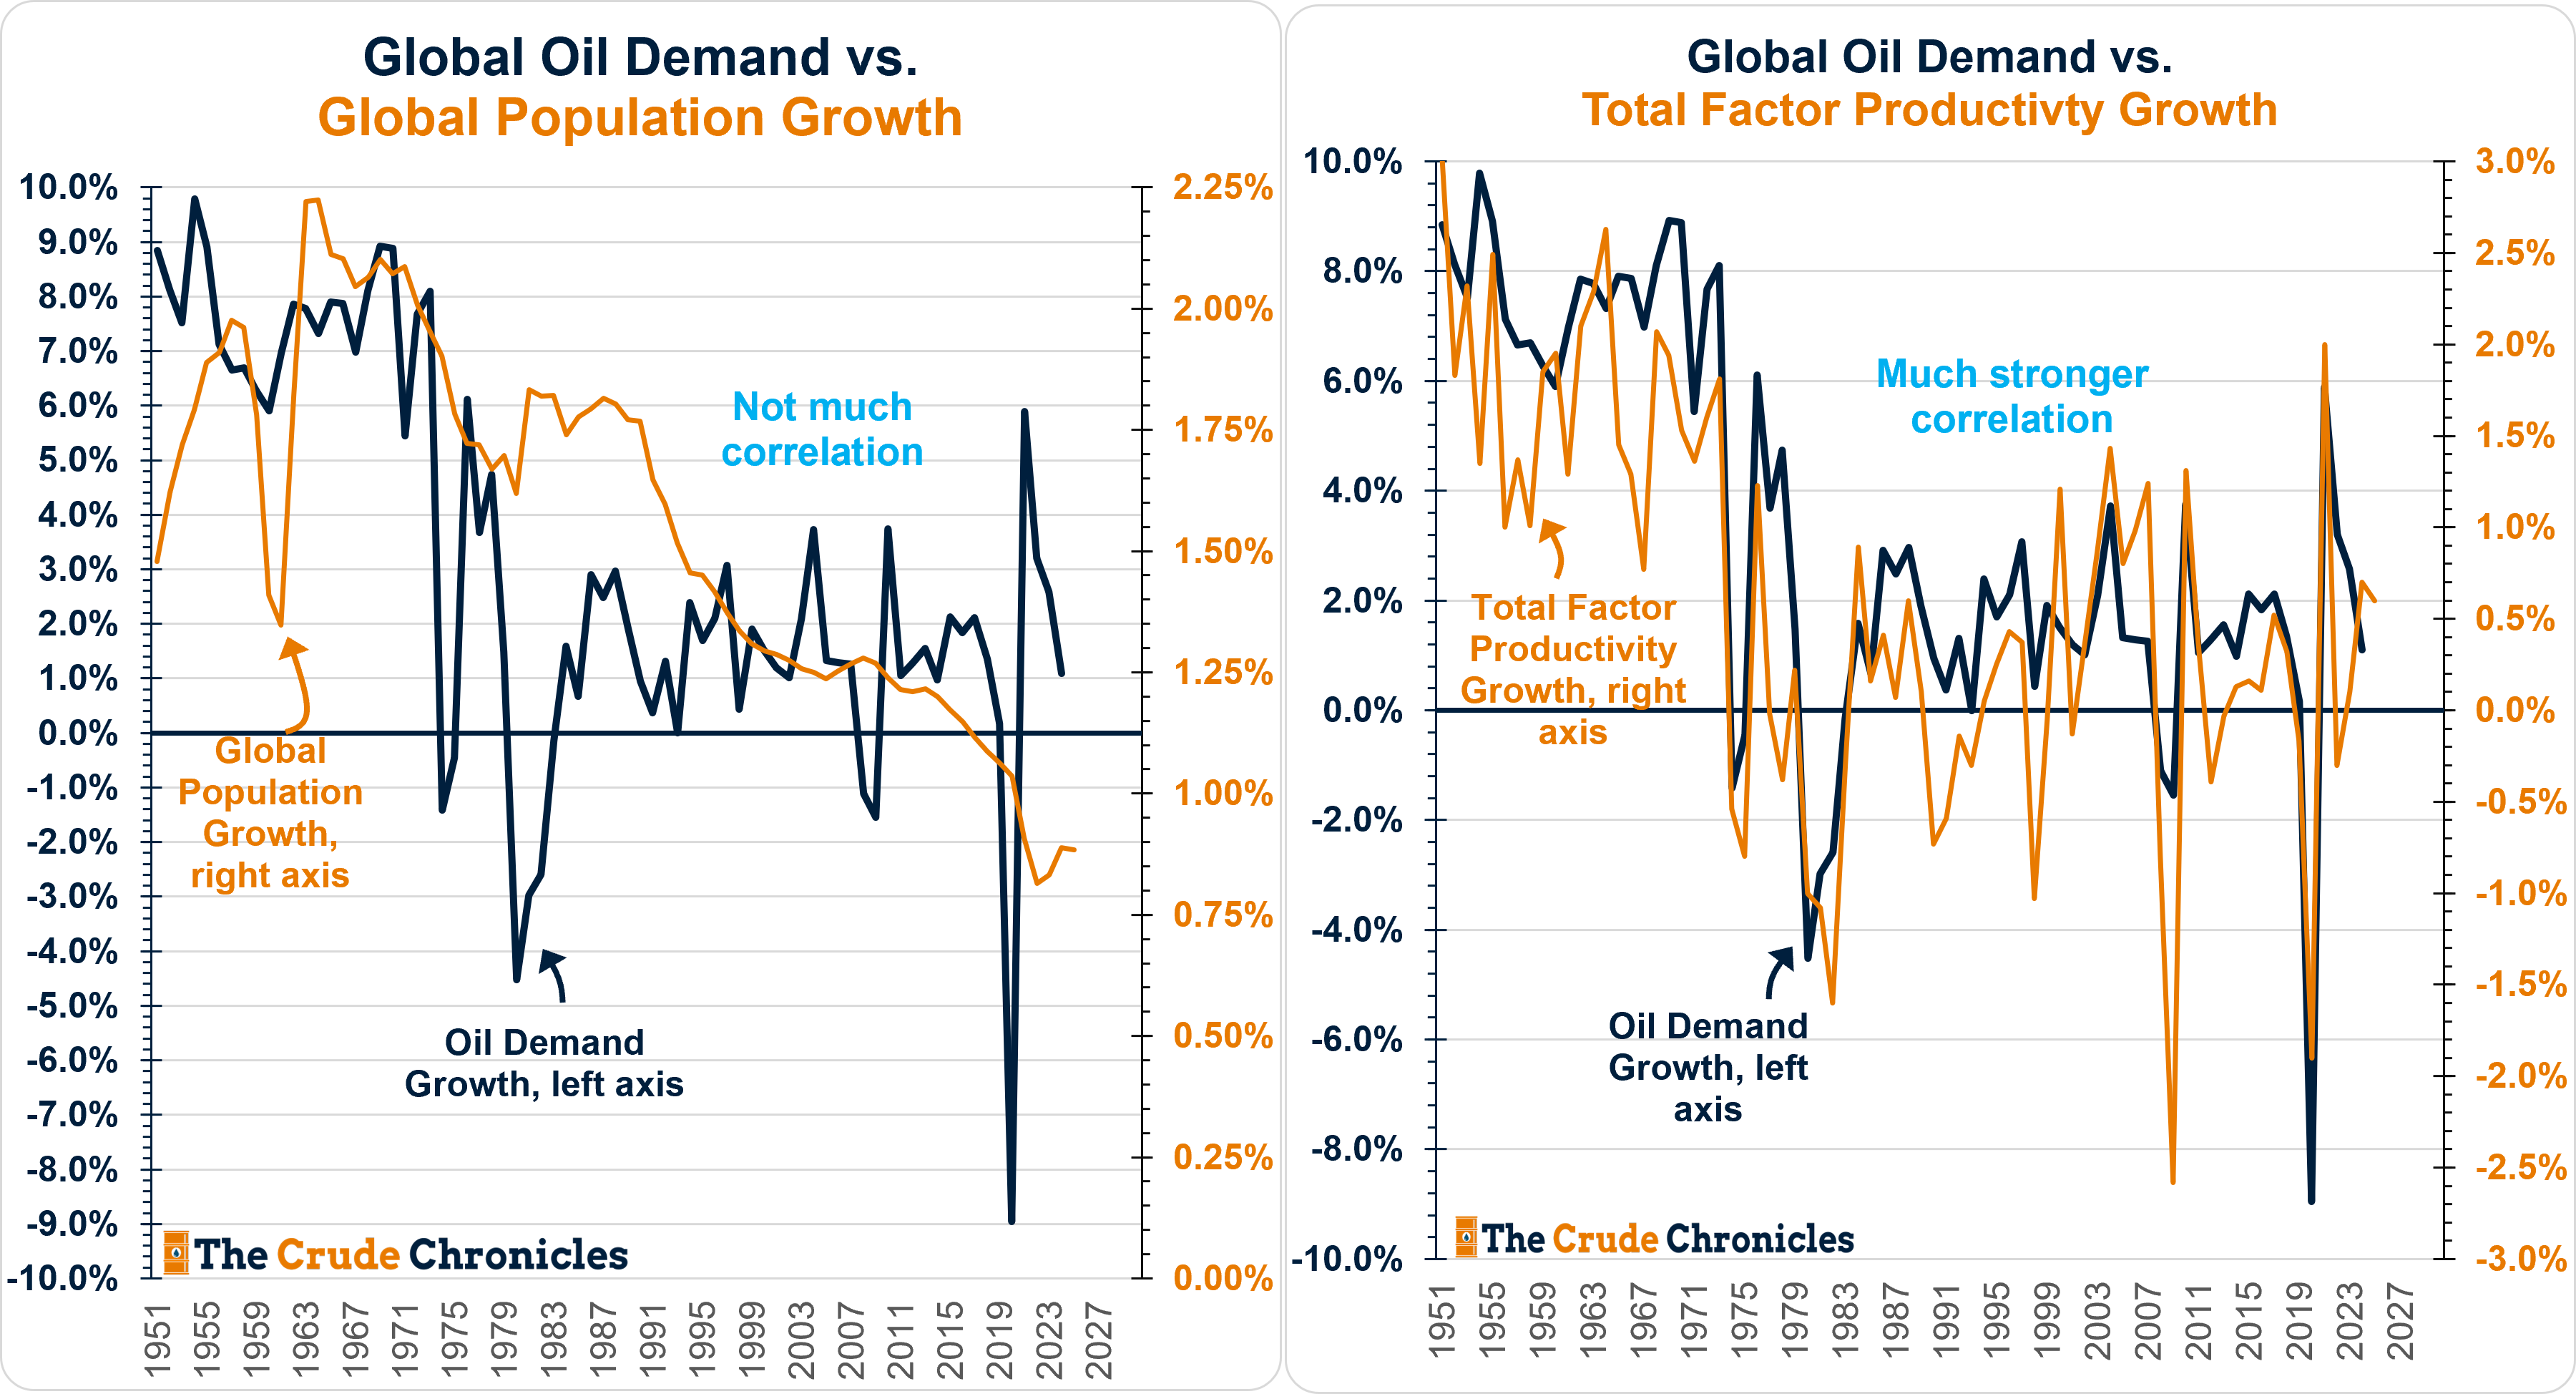
Thus if this AI capex bubble is to deliver a higher level of productivity growth in the future, it is ultimately bullish for hydrocarbon demand.
Consider Europe’s own experience.
In the late 1990s, Europe represented roughly 25-30% of global GDP, larger than China’s current contribution of roughly 15%-20%.
Since then the regions hydrocarbon consumption per capita has been in decline but this has not dramatically reduced global energy prices.
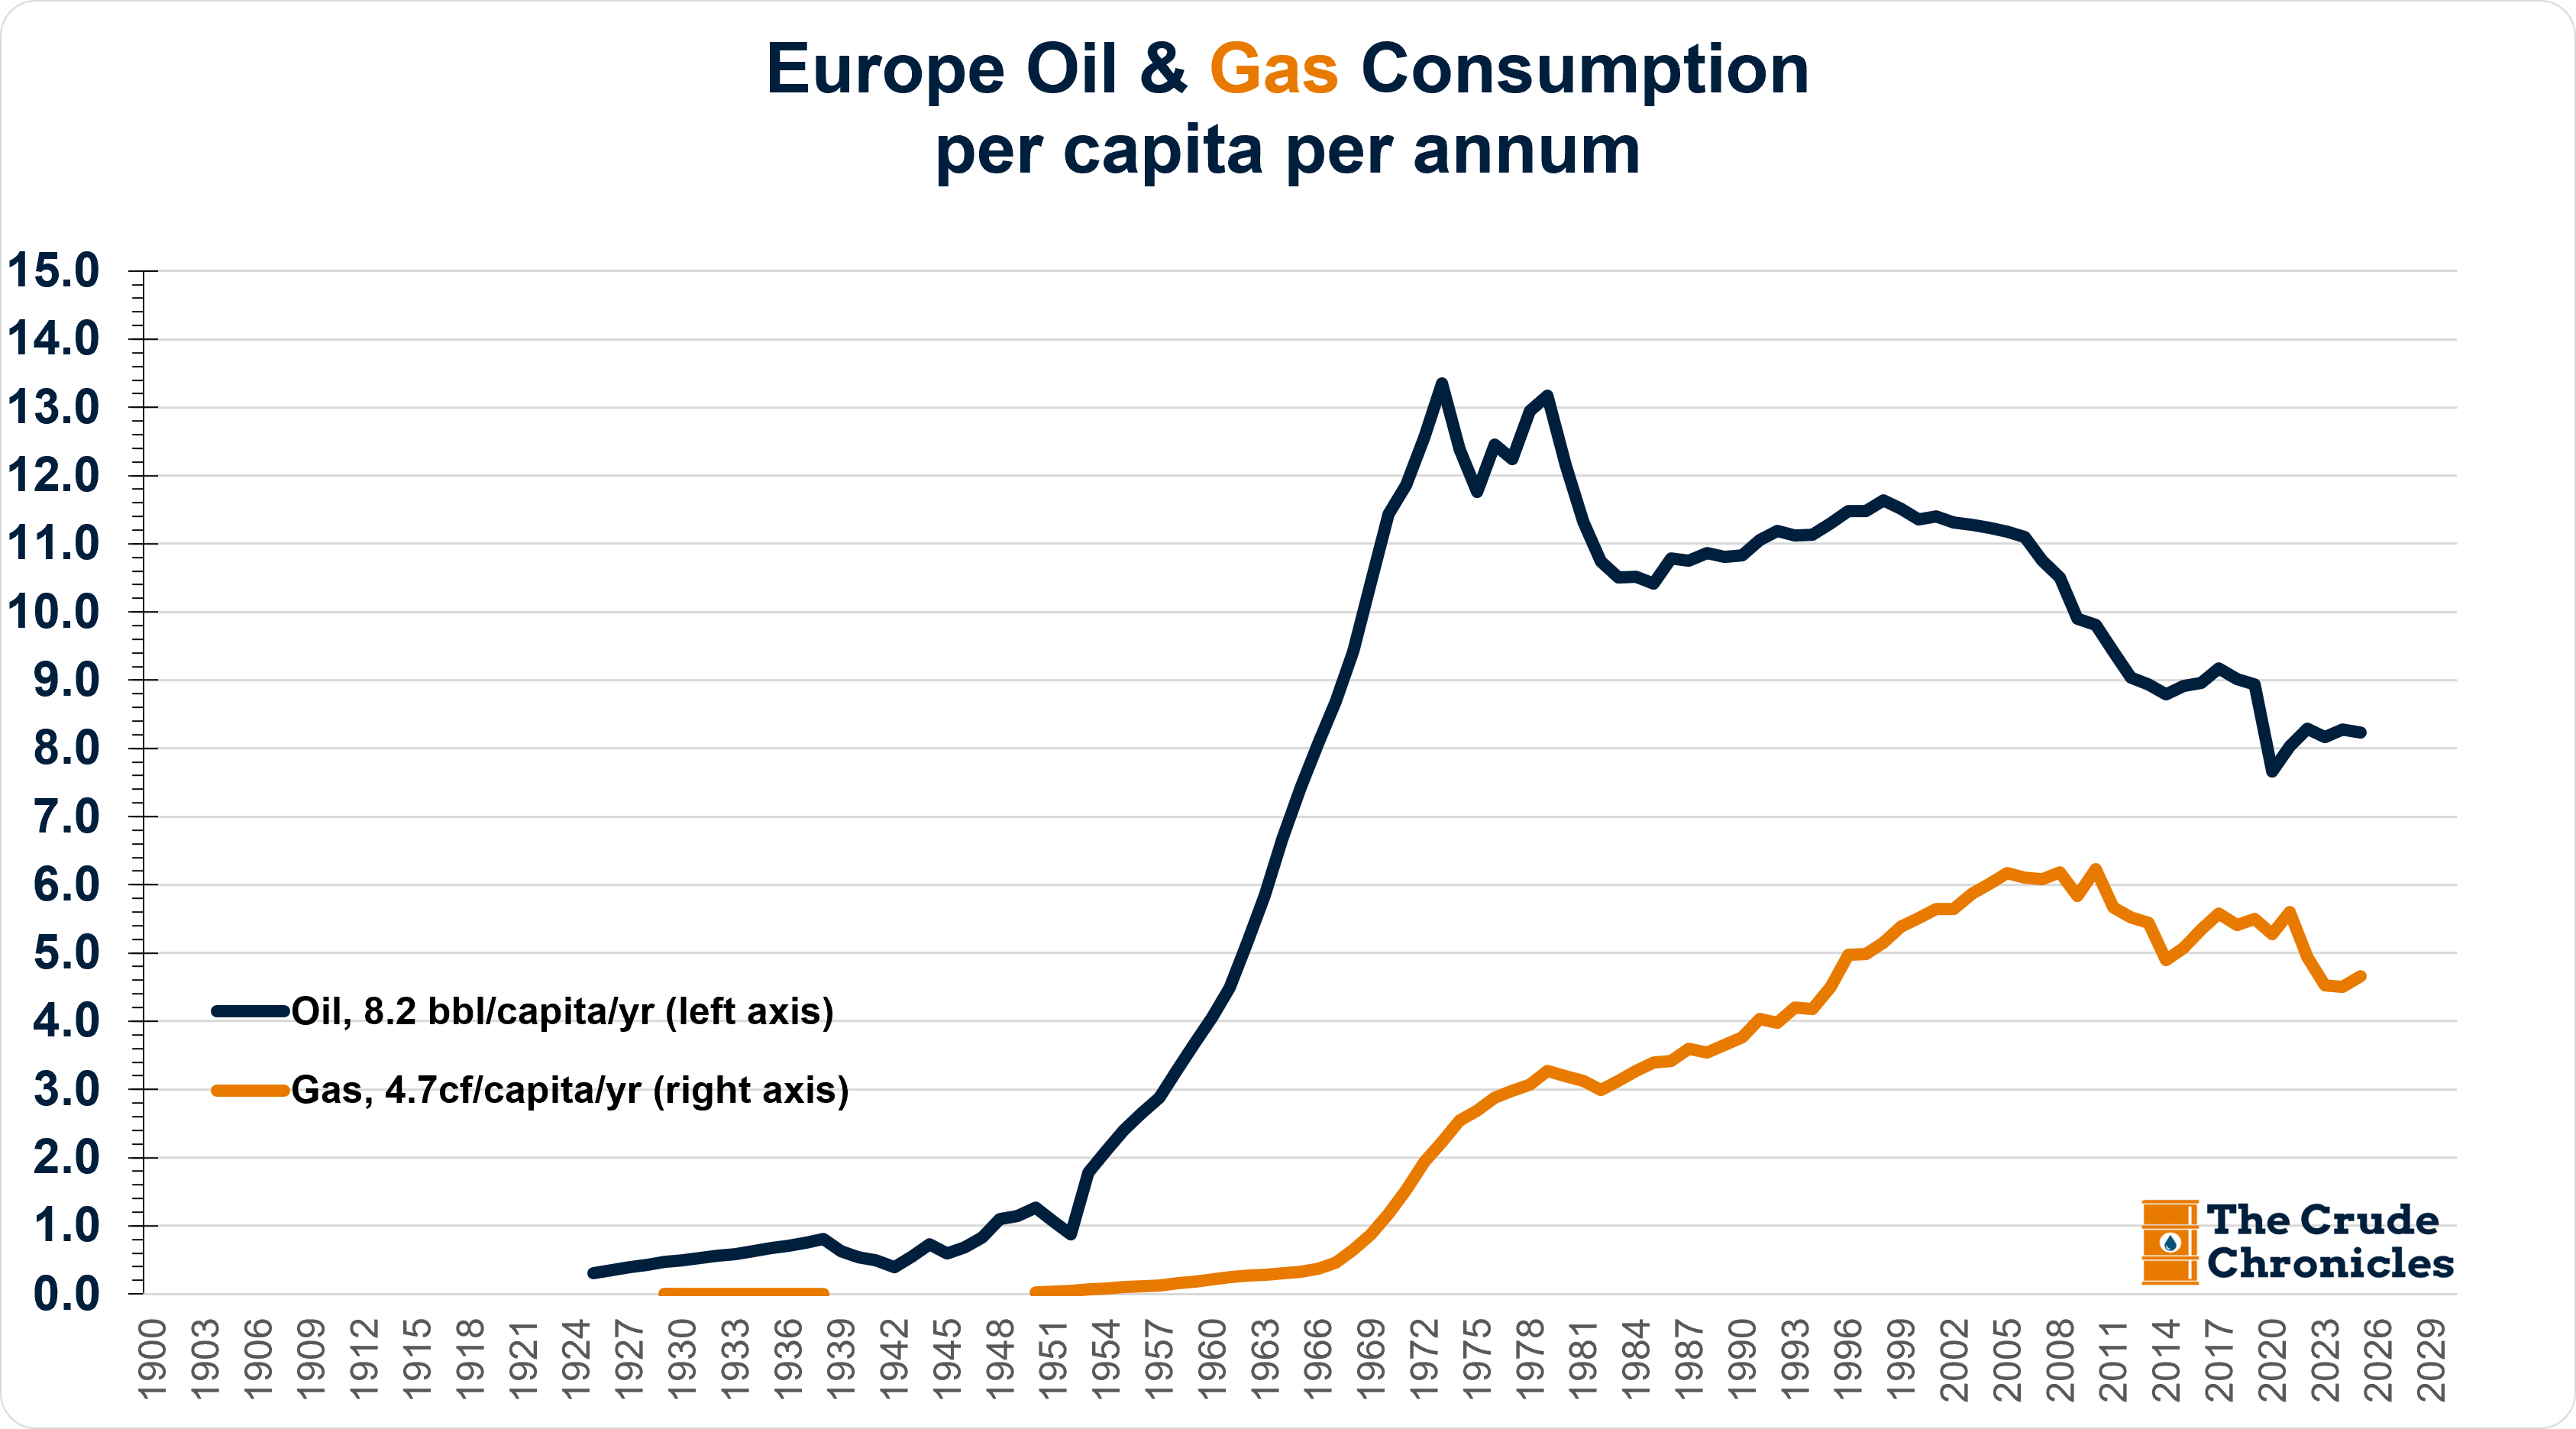
If Europe’s declining share of the global economy did not permanently depress oil and gas prices, why should we automatically assume that China’s slower growth will?
Nevertheless, global oil consumption per capita has remained remarkably stable, hovering around 4.6 barrels per person per year since 1983.
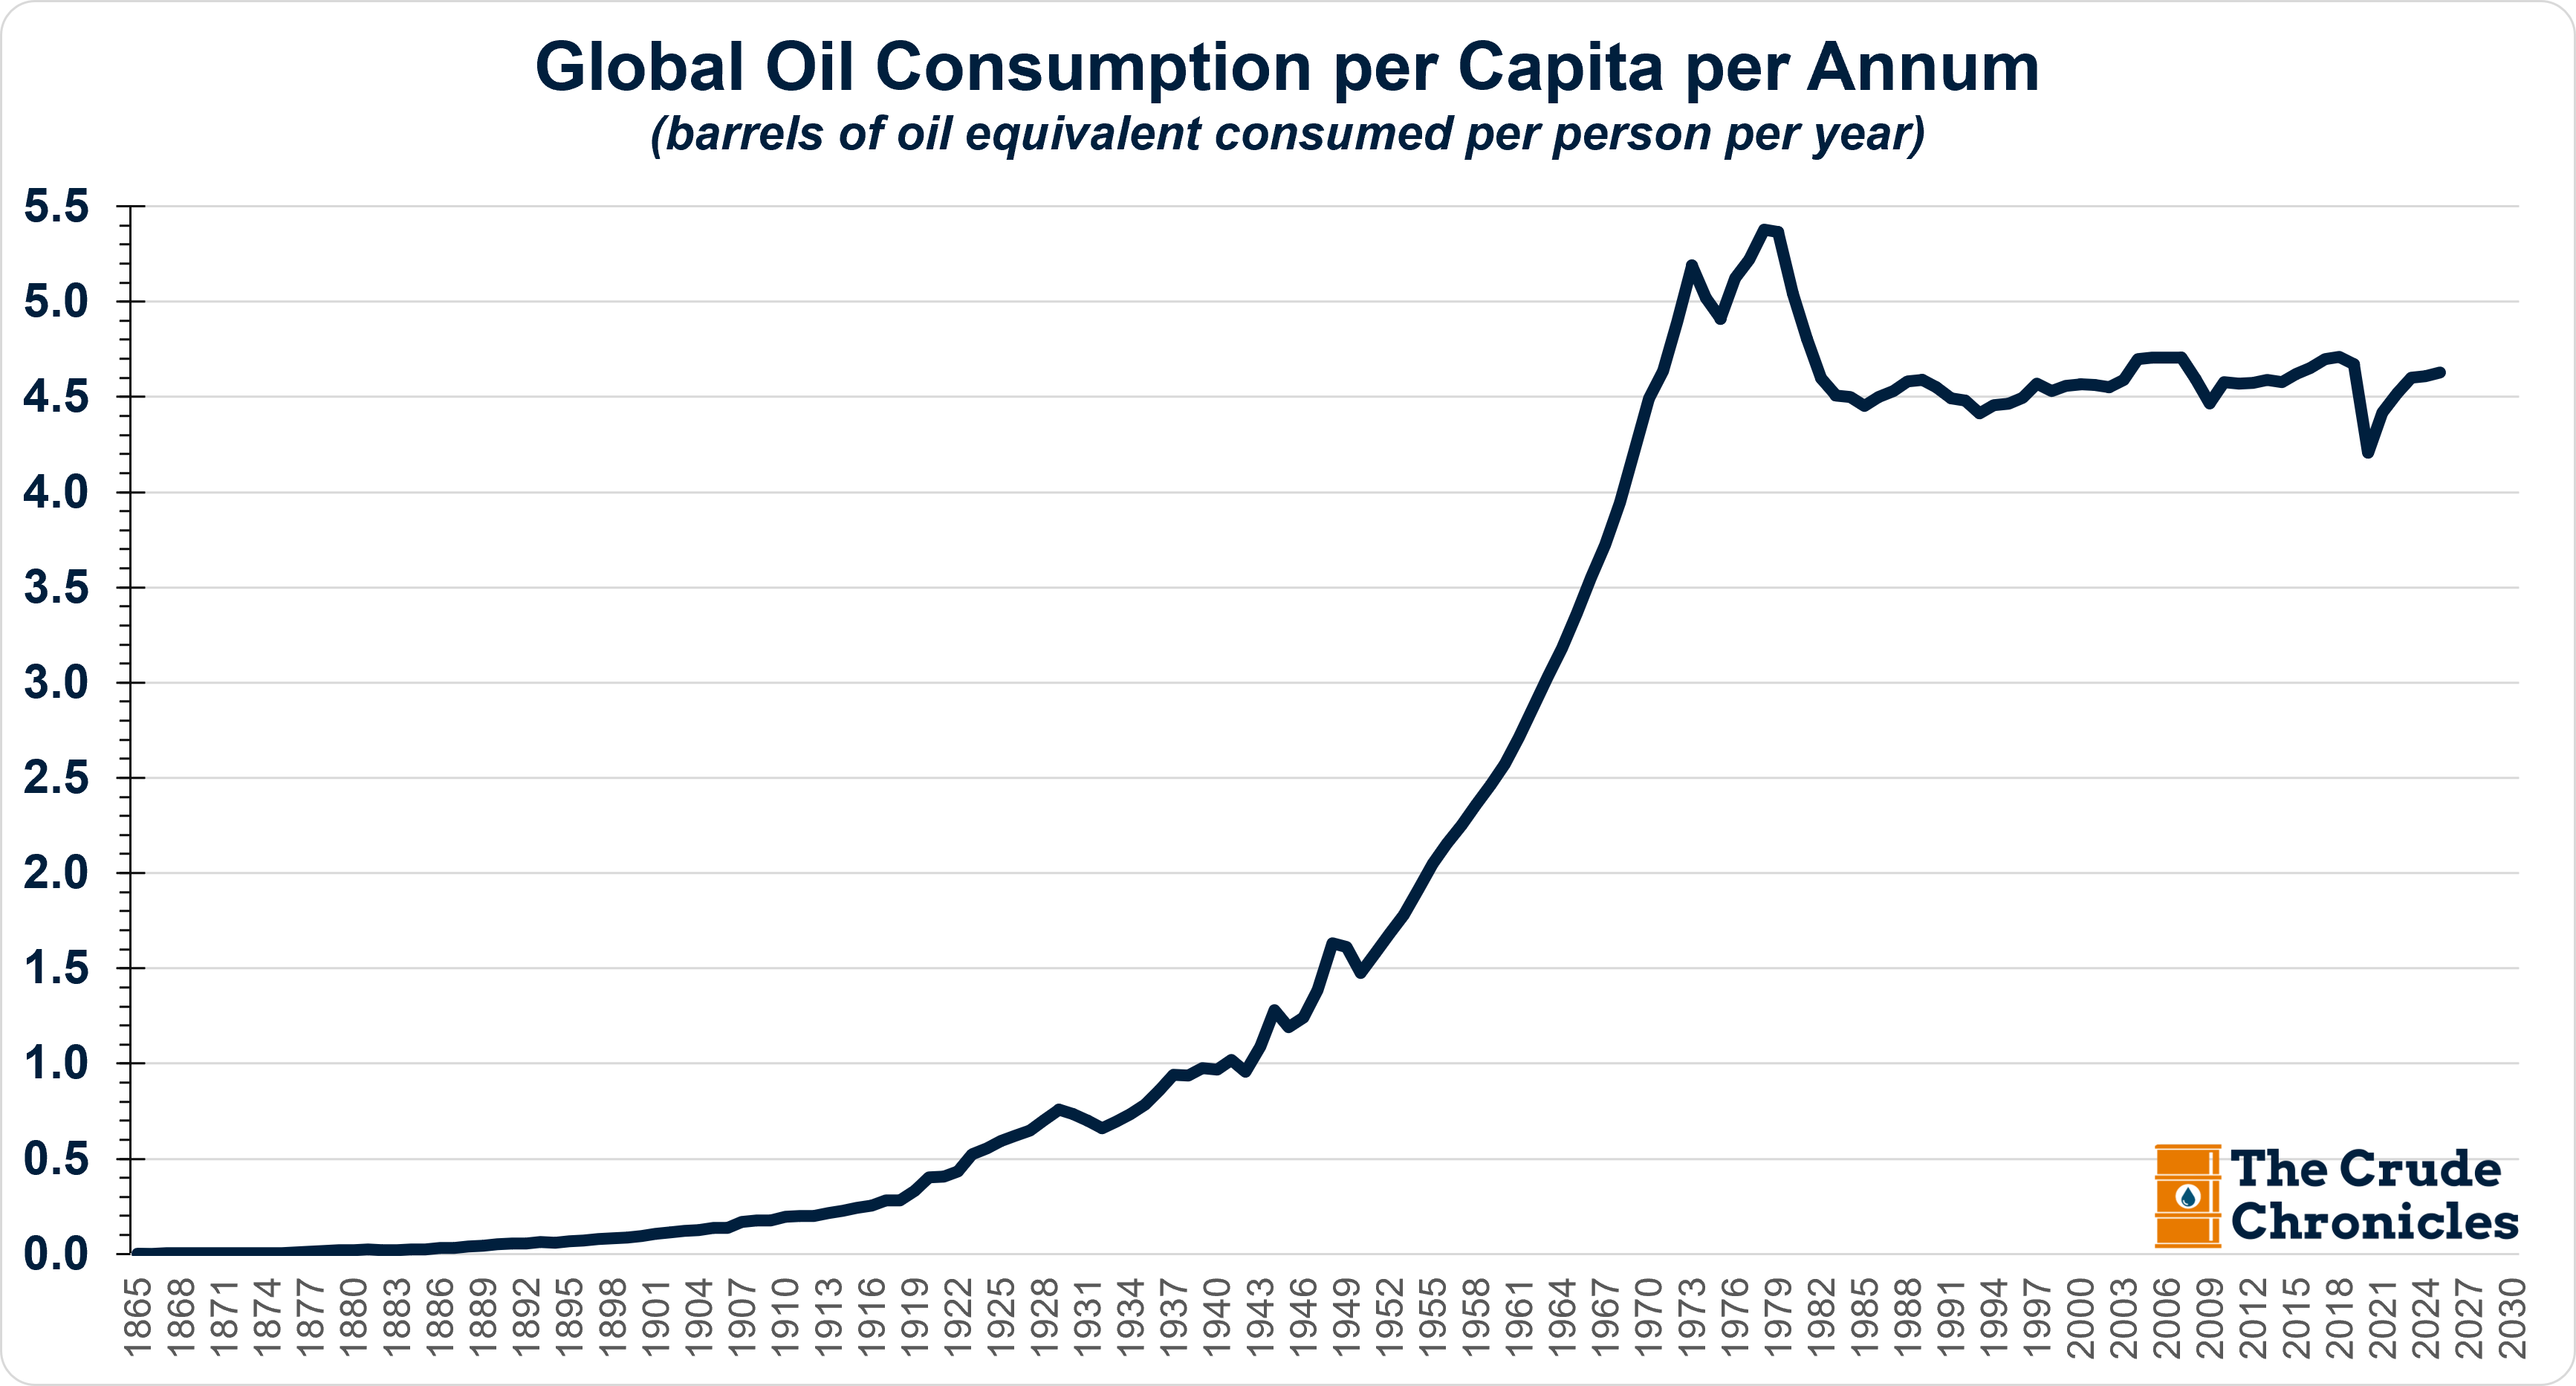
On the other hand, natural gas consumption per capita has continued to climb, keeping total hydrocarbon demand per capita on an upward trajectory and leaving the energy transition crowd waiting another day for hydrocarbons to relinquish their position as the world’s dominant fuel for economic growth.
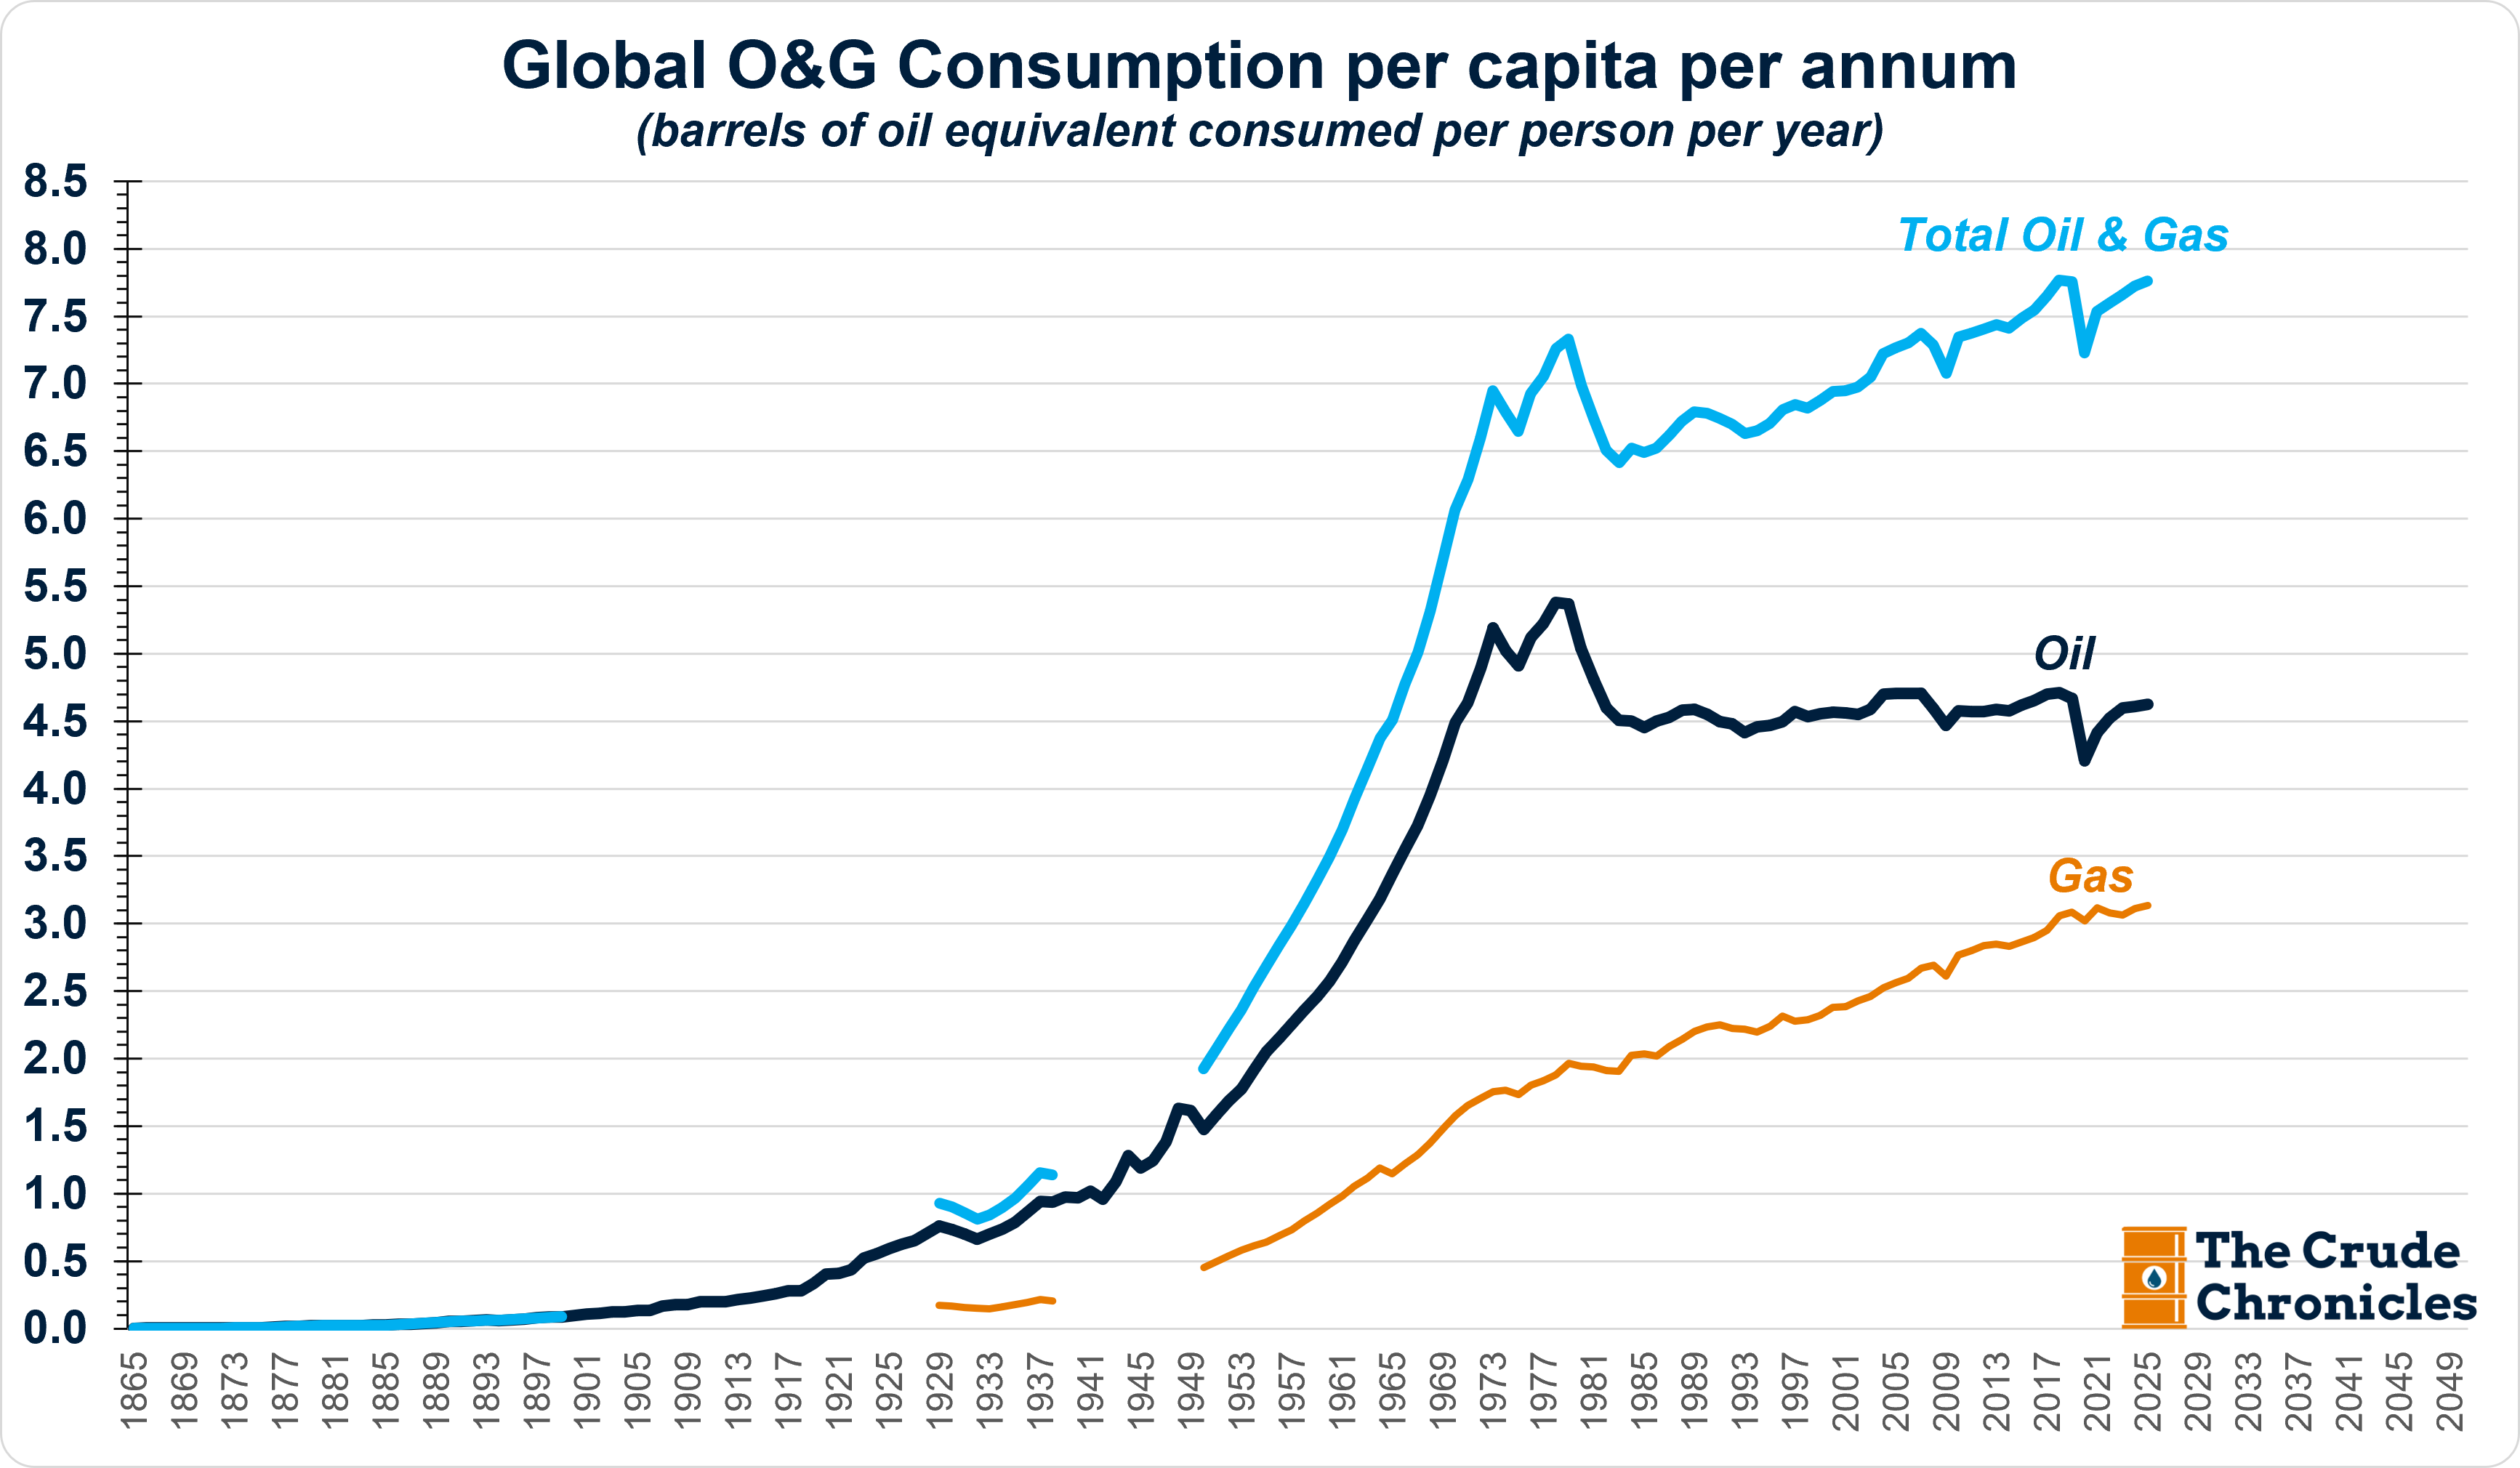
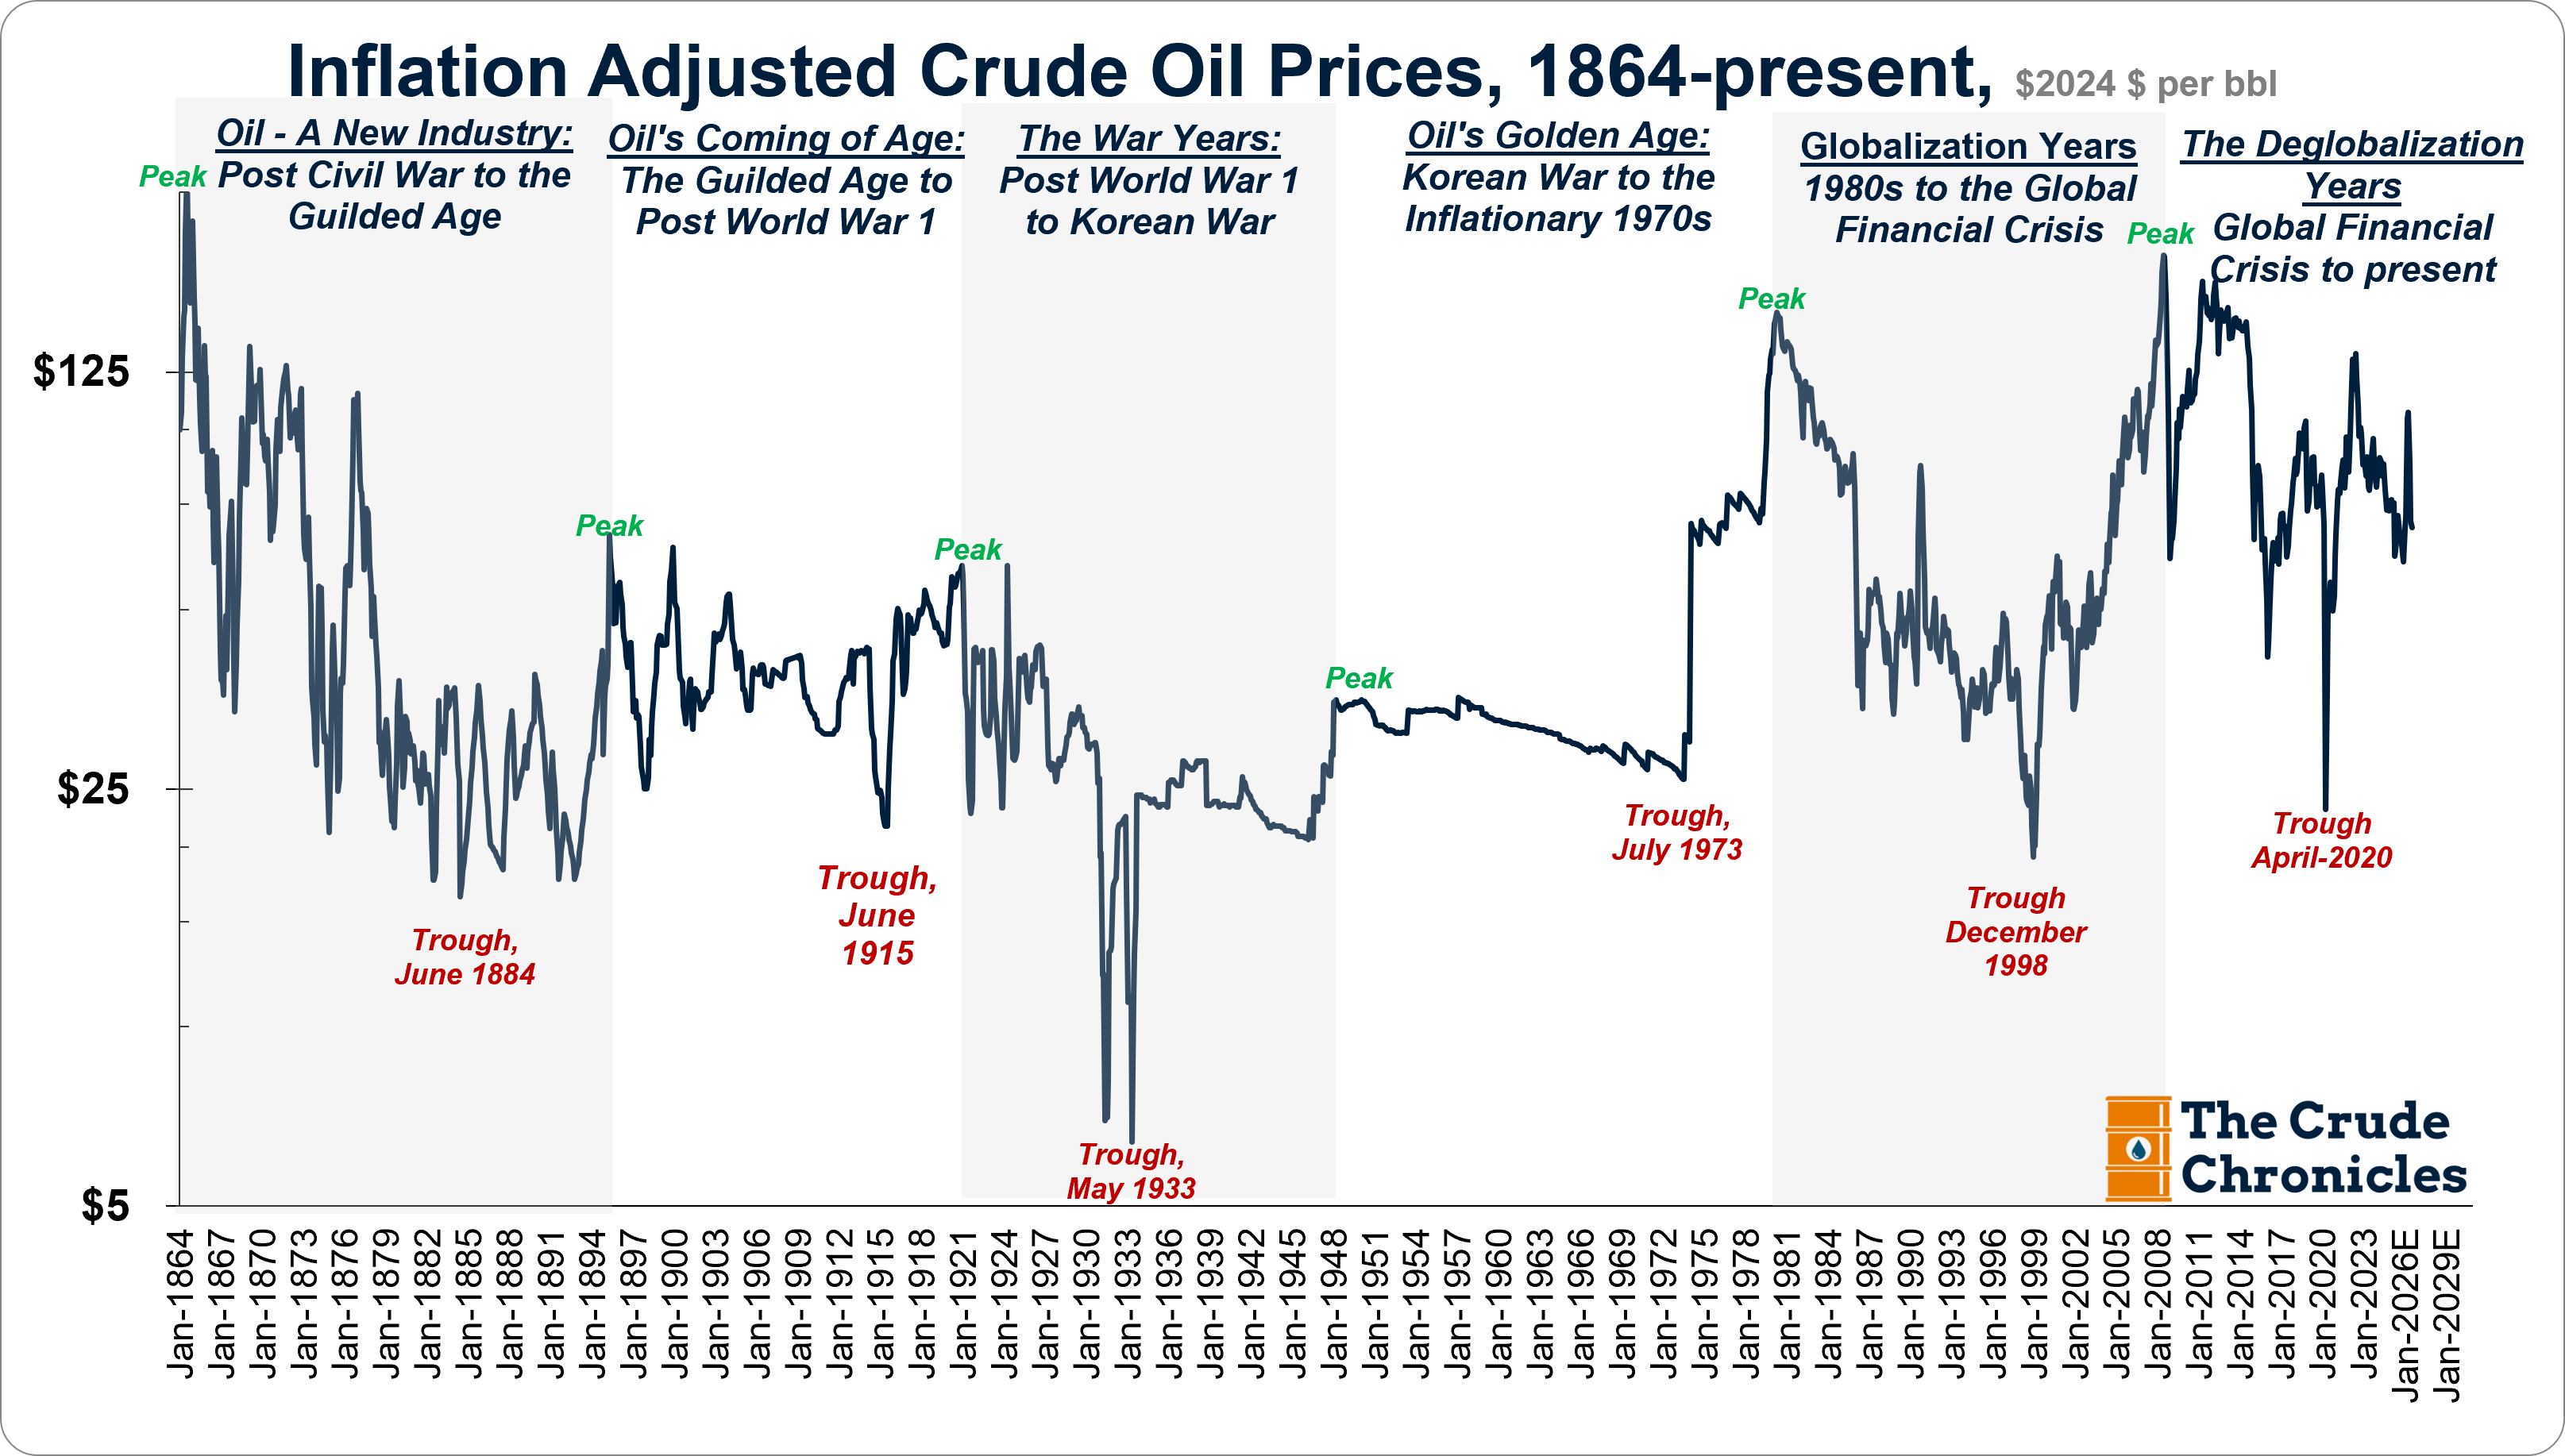
Another common refrain in the demand-versus-supply debate is that the world is simply less reliant on oil than it once was as shown below.
