
The most important chart in commodities.

A short & free one today for all subscribers. For those who haven’t converted yet, hit the link below and give it a shot. And for those already below the paywall, thank you for the support.
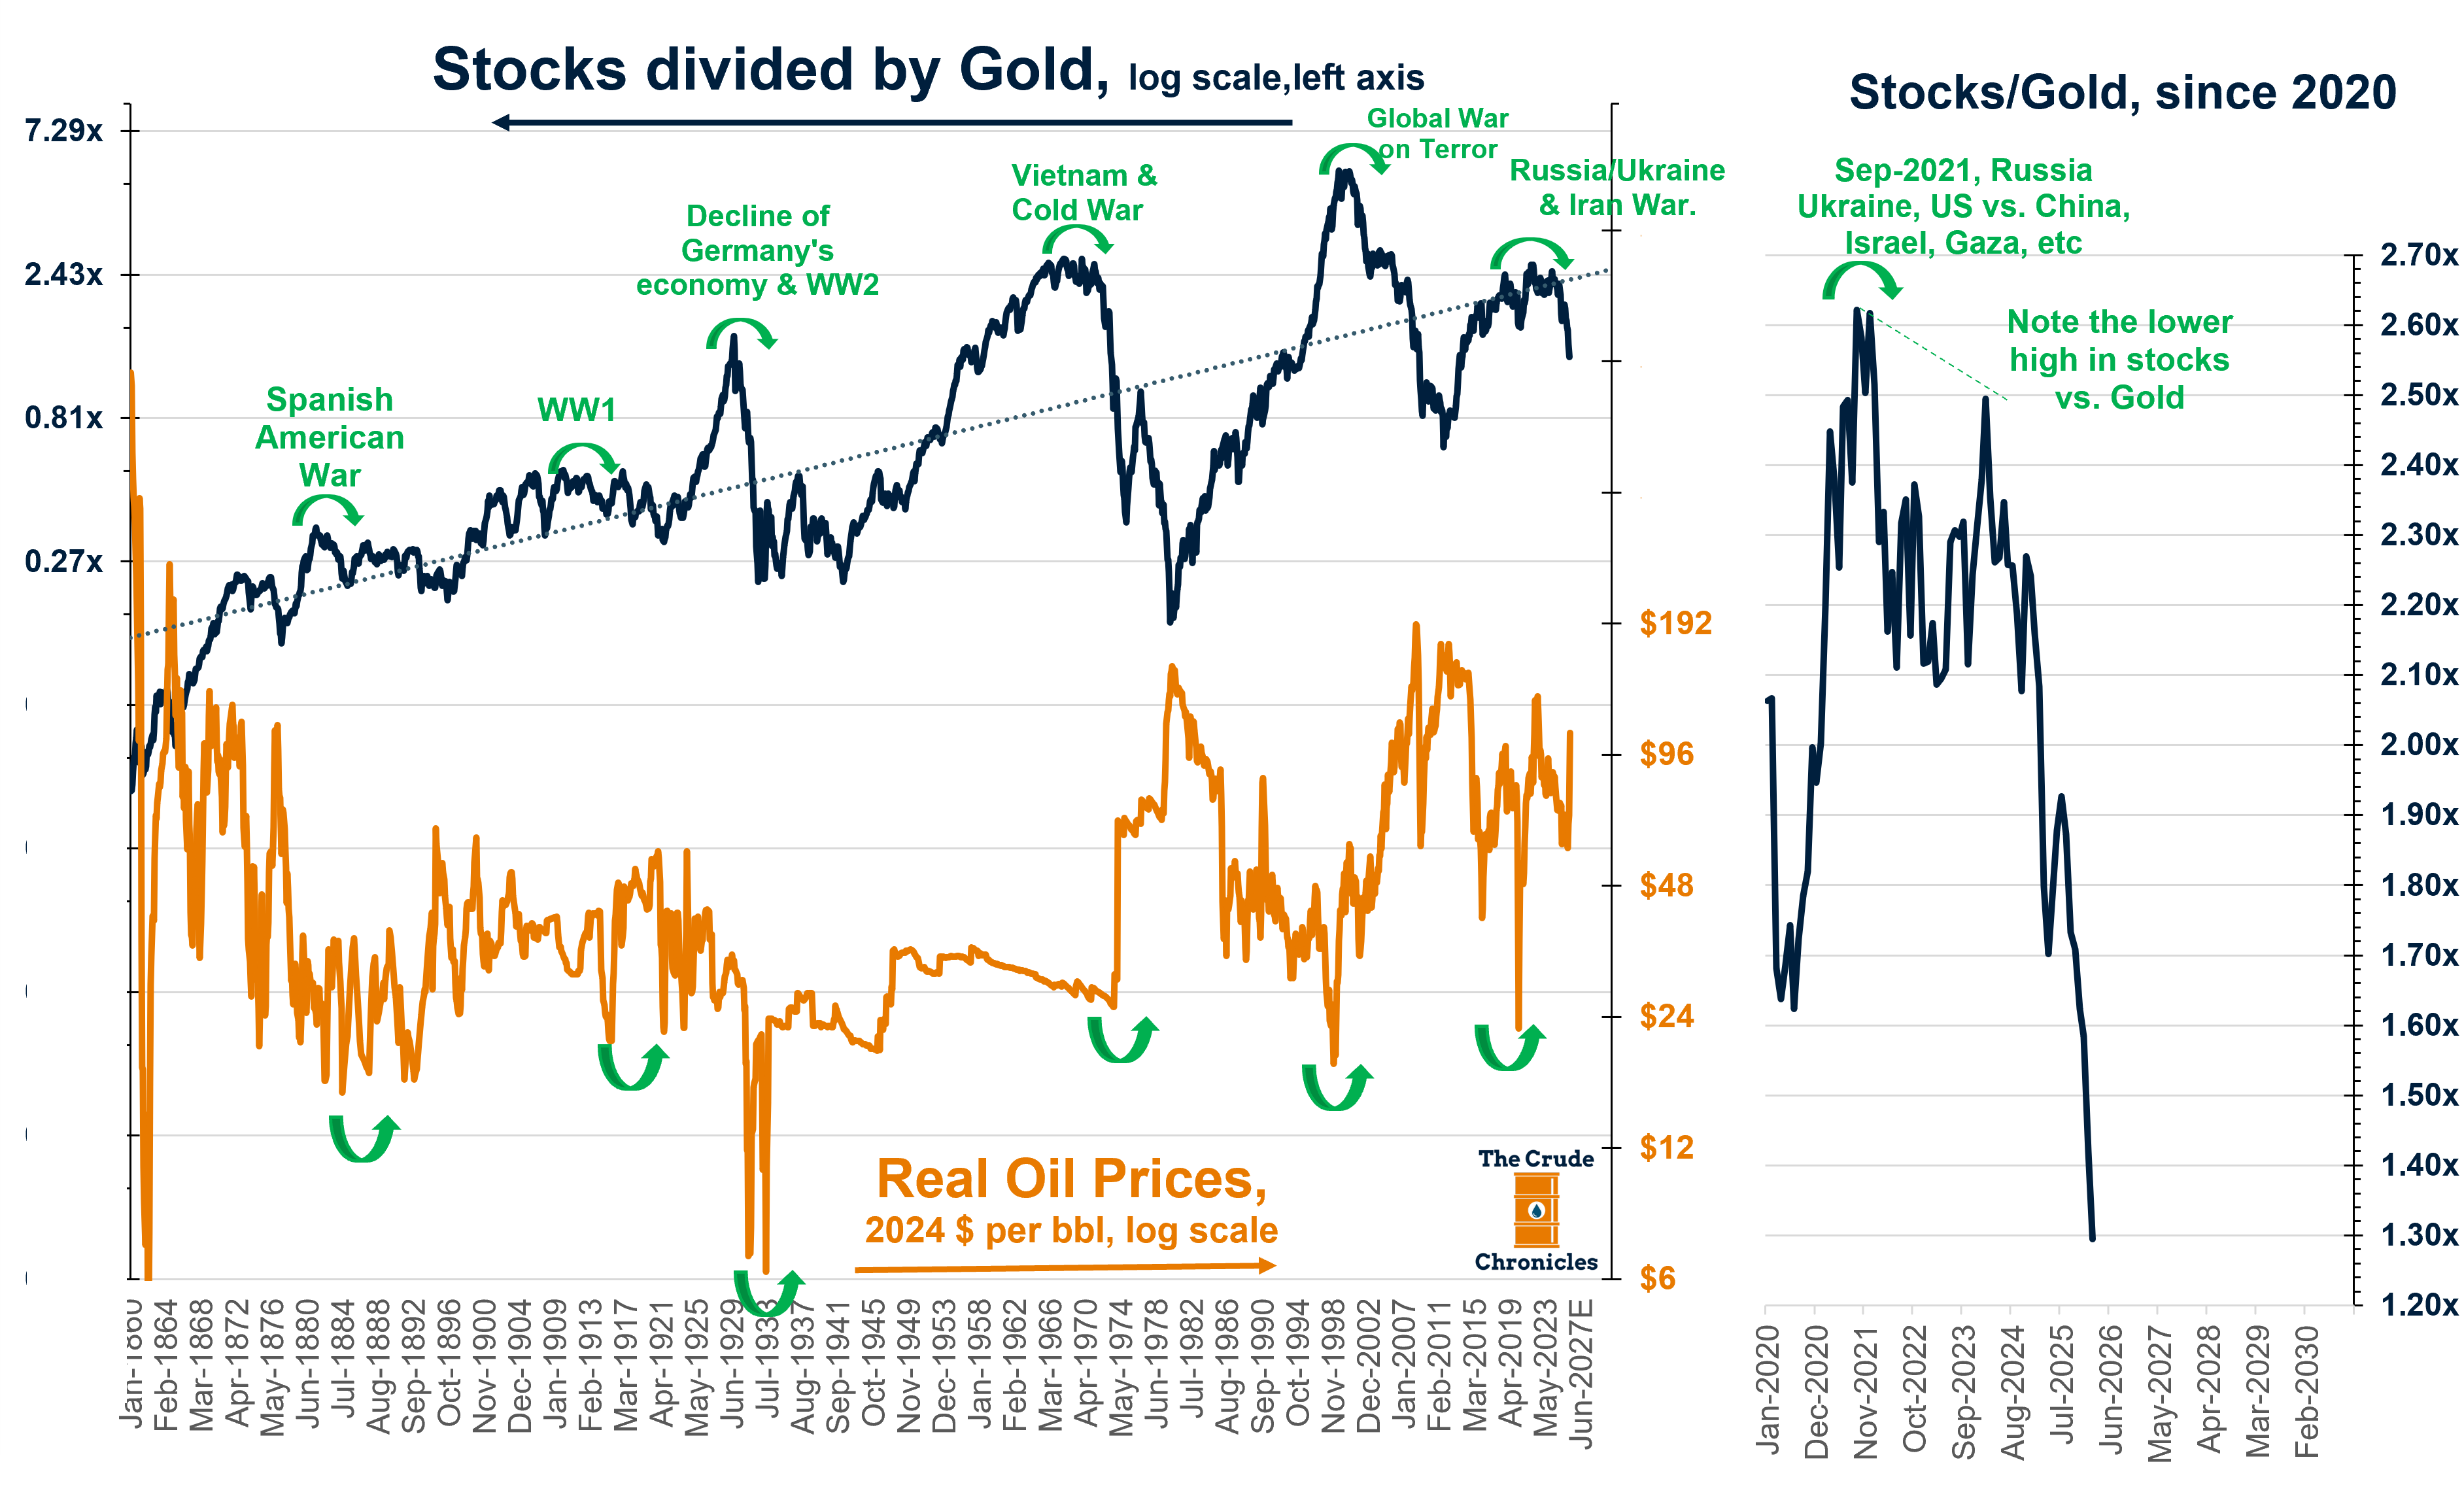
Long-time readers will know that I consider oil divided by large-cap U.S. equities (i.e., the S&P 500) to be “the most important chart in commodities.” (HERE).
Although after some lengthy discussions over the past two weeks with some of the best to ever do it in the commodities world, I’m seriously reconsidering. The stocks-to-gold ratio—and gold itself—might be up there with it.
Gold is like Sauron’s eye in Lord of the Rings—it sees everything that is coming.
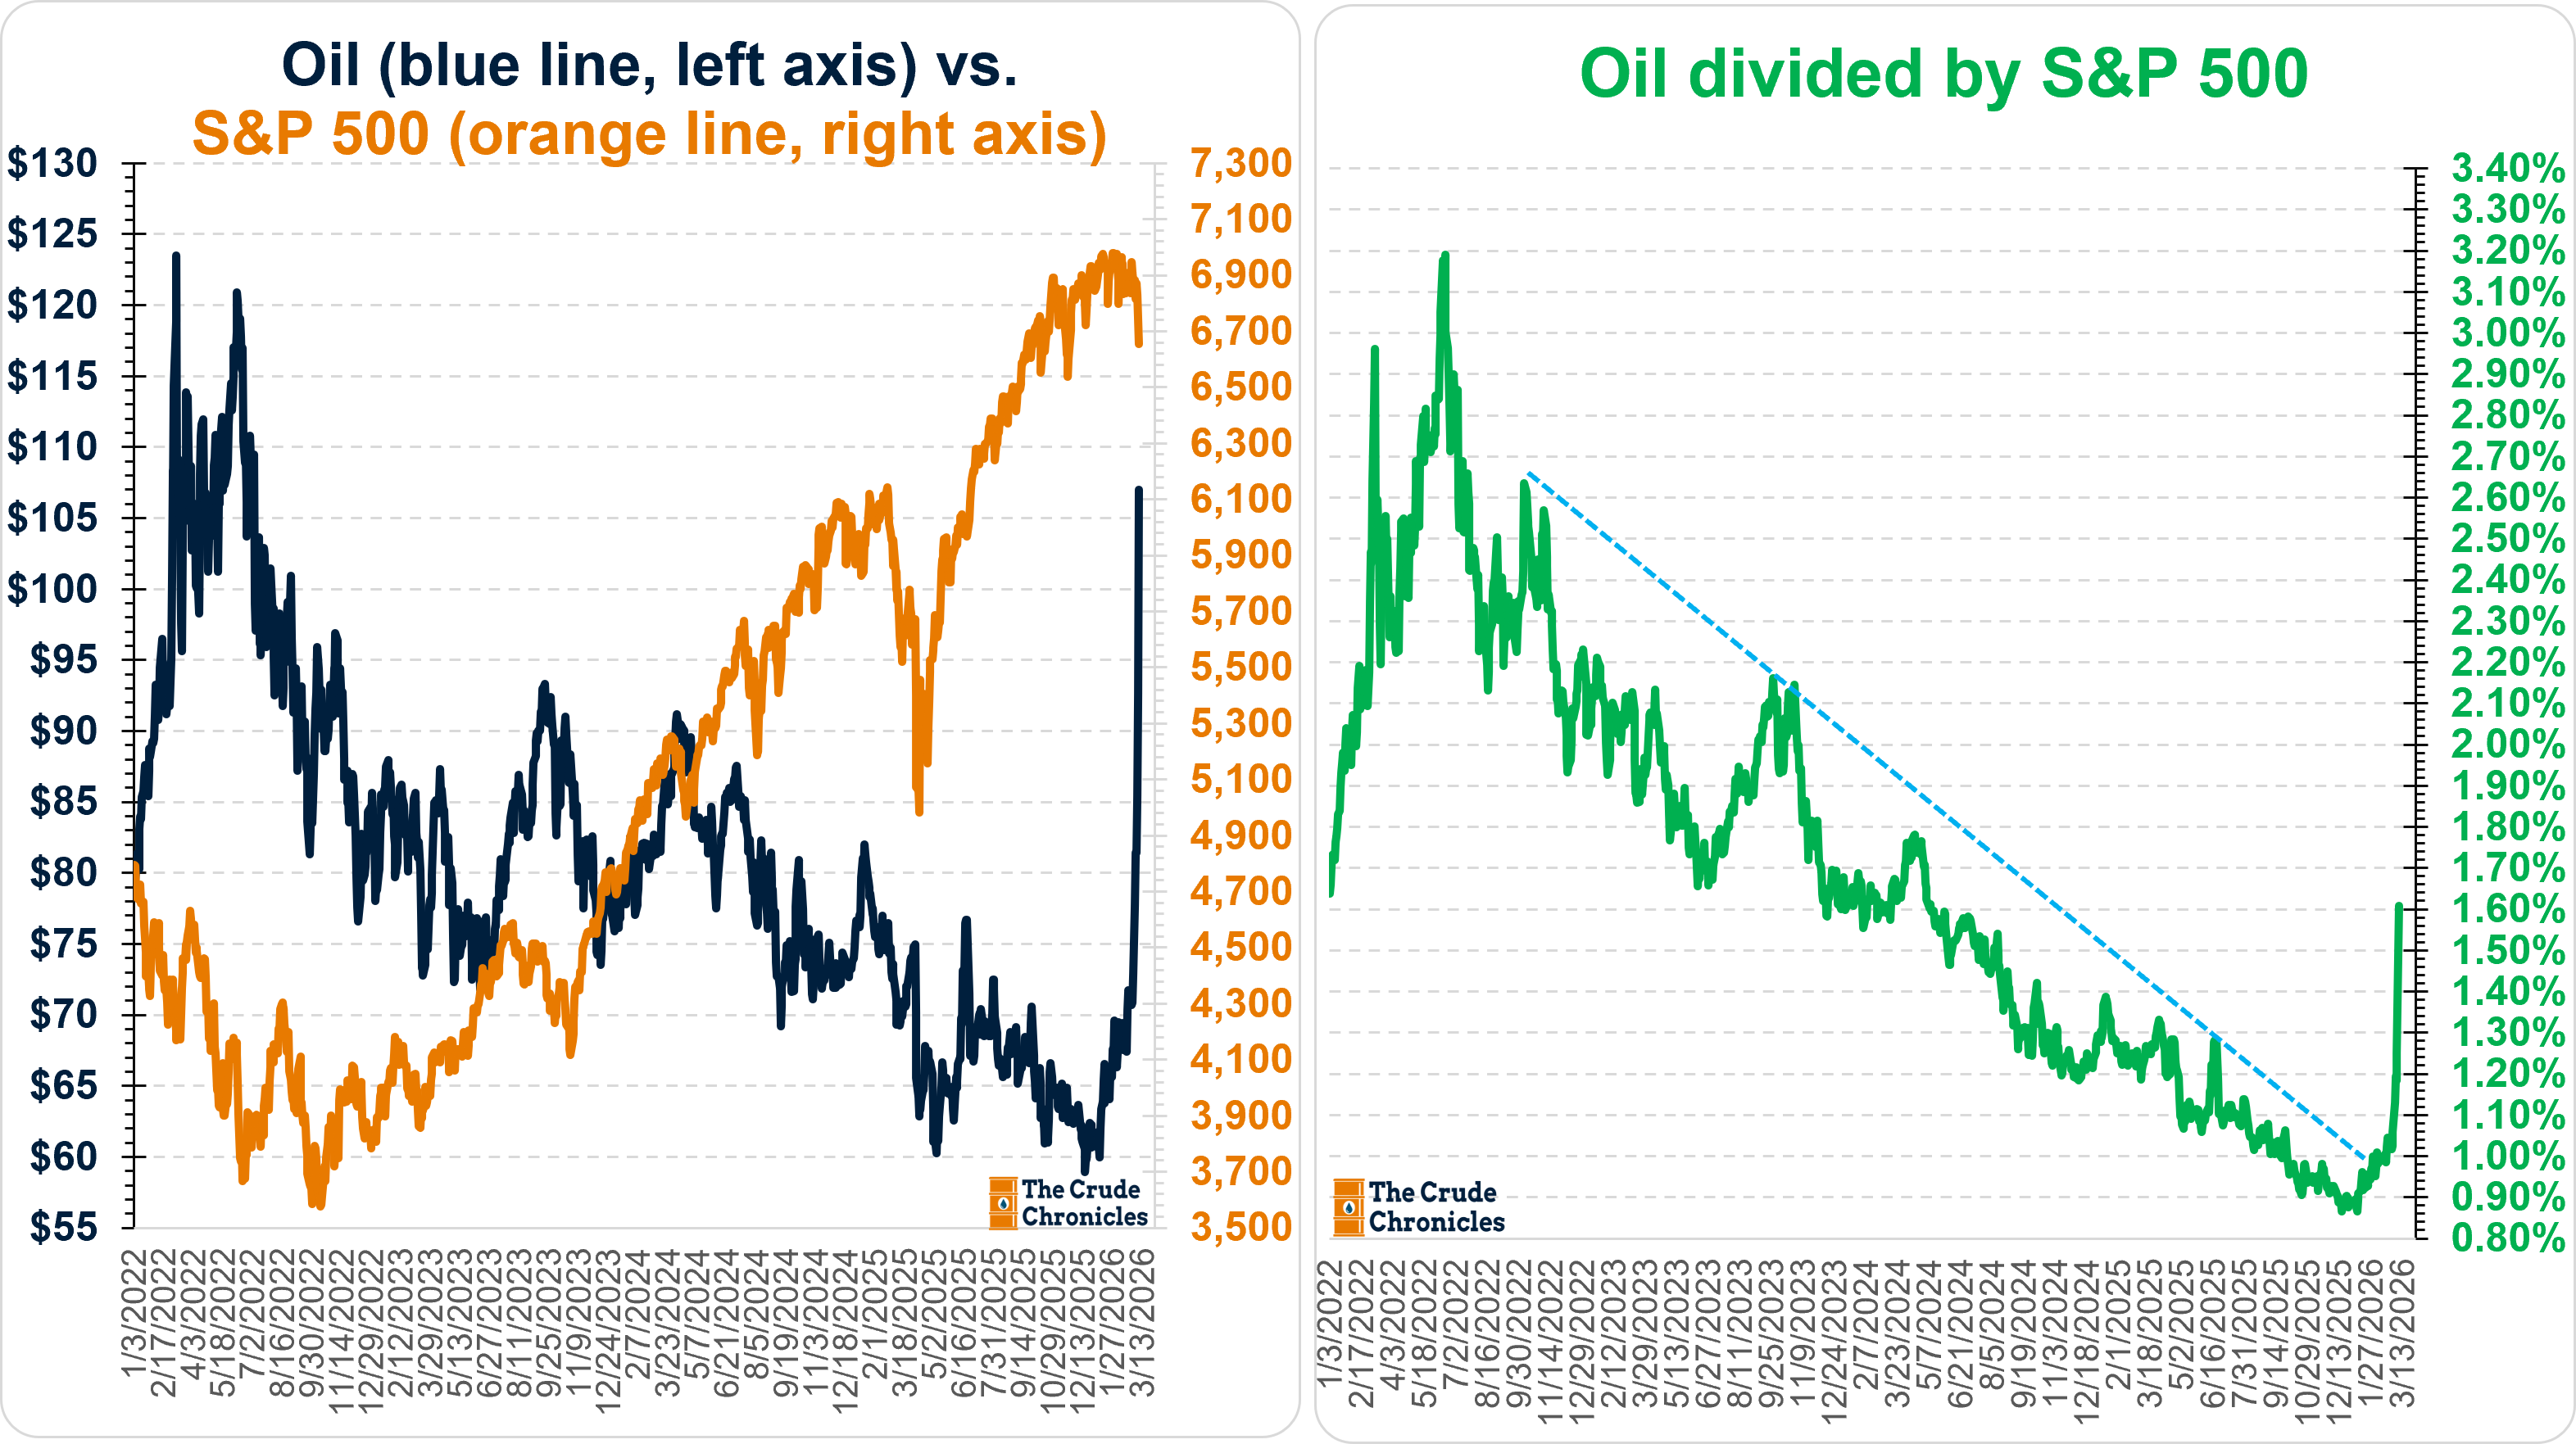
But back to oil versus the S&P 500.
These cycles tend to alternate price leadership every 12–13 years.
We made another major bottom in April 2020, and for two years that call proved correct through June 2022.
From the summer of 2022 until recently, however, the oil-to-S&P ratio had been trending downward.
With the events of the past week, though, the ratio has clearly bounced.
A zoomed-in version looks like the following.
I transformed the above chart into a zoomed-in version starting from 1949 and found a regular pattern that occurs:
Step 1 - A bottom is put in.
Step 2 - The downtrend is broken, and a higher low is established.
Step 3 - A long series of higher highs and higher lows takes hold
Step 4 - The peak is put in, and few notice it.
Step 5 - Oil-to-S&P rallies but fails to break through the peak, signaling to jump ship.
Step 6 - A long series of lower highs and lower lows.
Rinse and repeat.
Of course, there will be volatility, and my base case is that the taco truck is just around the corner as threats to the global economy erupt rather quickly. What’s changed is the new Iranian leadership clearly does not want to eat from Trump’s Taco Truck.
So watch this ratio—oil to the S&P 500. I think we may have just gone through step two.
Or hit the button below, subscribe and I will watch it for you.
-Rob Connors, CFA, CPA, Oil to SPX’er
Disclosure & Terms of Use
Nothing in this content should be considered personalized financial advice or a solicitation to buy or sell any securities.
The content provided here is for informational purposes only. You should not construe any information or other material as investment, financial, tax, or other advice. The views expressed by The Crude Chronicles LLC are solely their own. Nothing in this content constitutes a solicitation, recommendation, endorsement, or offer to buy or sell any securities or other financial instruments in any jurisdiction. An investment in any financial instrument involves risks. Some or all the securities discussed may not be suitable for you. Please consult your own investment or financial advisor for advice related to all investment decisions.
Terms of Use: Paying subscribers are permitted to use these charts for their own use (i.e. sharing internally or within published research to external clients) provided proper sourcing is used. Please source as “thecrudechronicles.substack.com”