Hey everyone, I recently had the pleasure of being a guest speaker for a group of individuals who when it comes to the world of oil & gas, to put it simply…
They know their stuff!
I got great feedback on the charts that I asked myself, “Why am I not putting this compilation of charts out on a more frequent basis?”
So as we head into 4Q23 I am providing my first quarterly chart deck with the title and theme,
Transitioning from Doubt to Optimism (We just may have to go through a recession to get there).
It has some charts from my recent presentation and a bunch more!
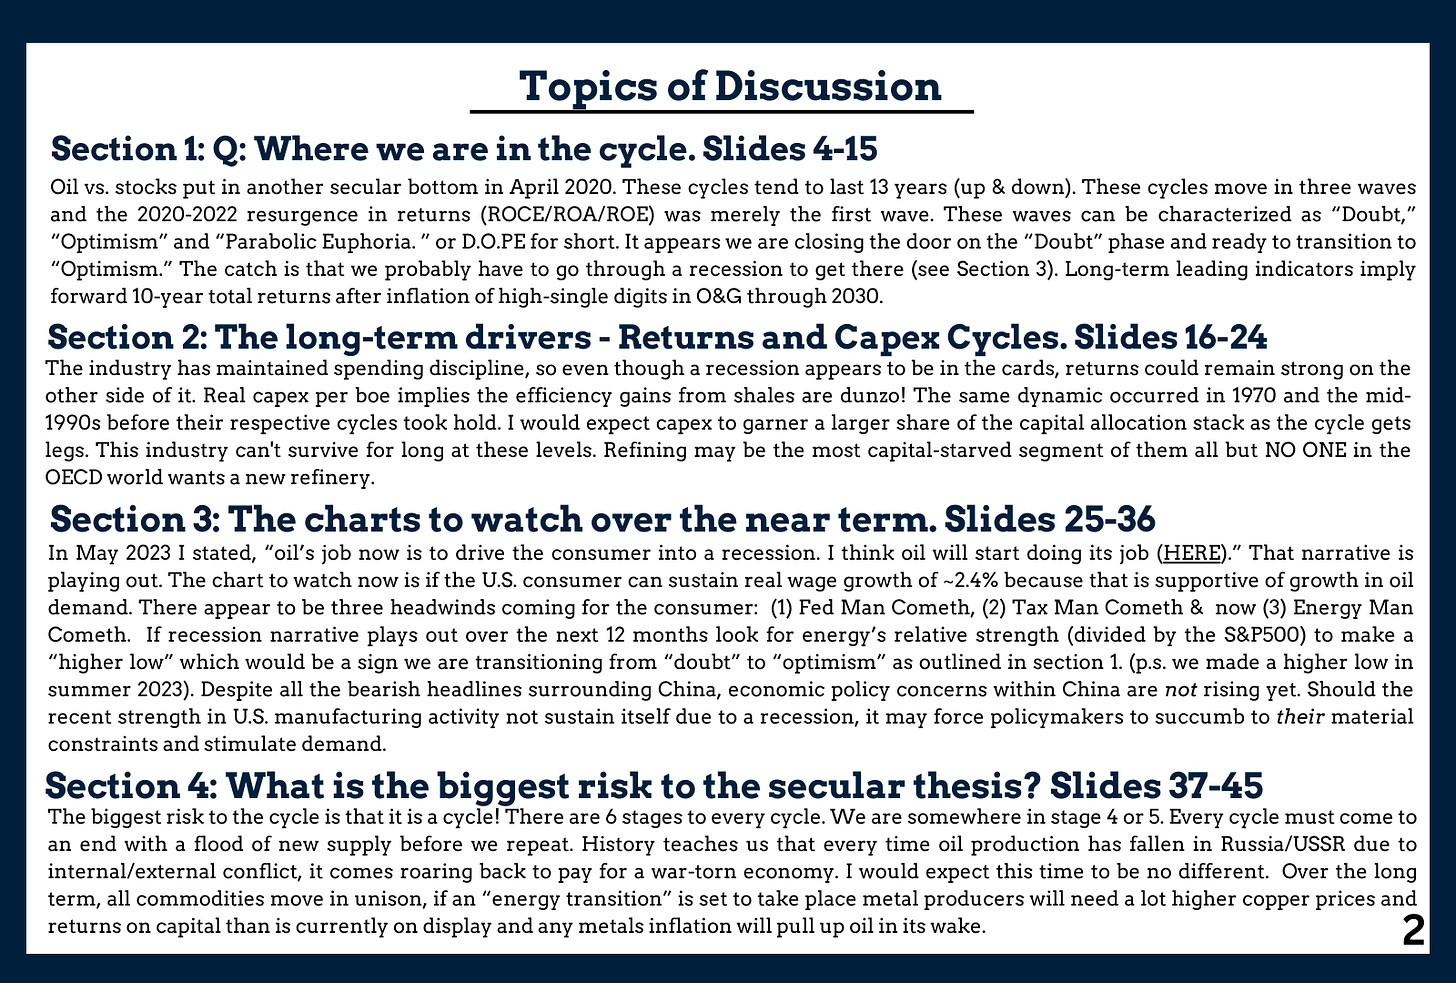
Here are the key points discussed in this 45-page slide deck (I know it’s beefy but the content is good!)
If you are a paying subscriber I would like to thank you for your continued support. See the pdf below. Please feel free to holler at me. I reply to my supporters. You are making my vision come true!
If you are on the fence, well maybe this chart pack will convince you. Some of the brightest minds in O&G loved it, maybe you will too!
Last minute bonus - Below the chart pack are some long-term historical charts on ExxonMobil. These were added to provide some long-term historical context of the recent on again off again merger news with Pioneer broken by the WSJ last night. Enjoy.
-CC
ExxonMobil and Pioneer - Some thoughts.
I am not going to about synergies, estimates, or guidance but rather provide historical perspective on the WSJ news of an impending deal
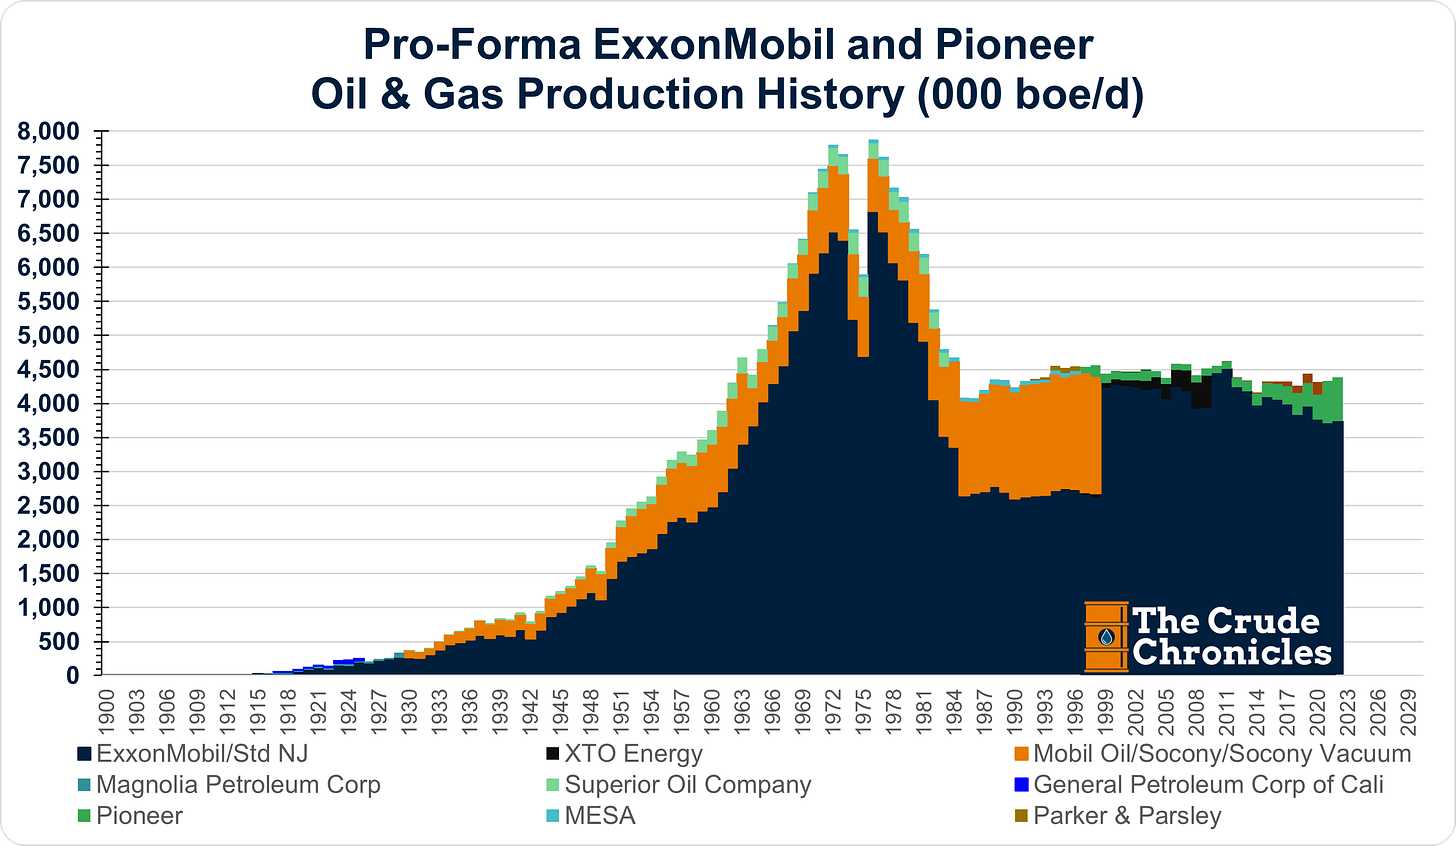
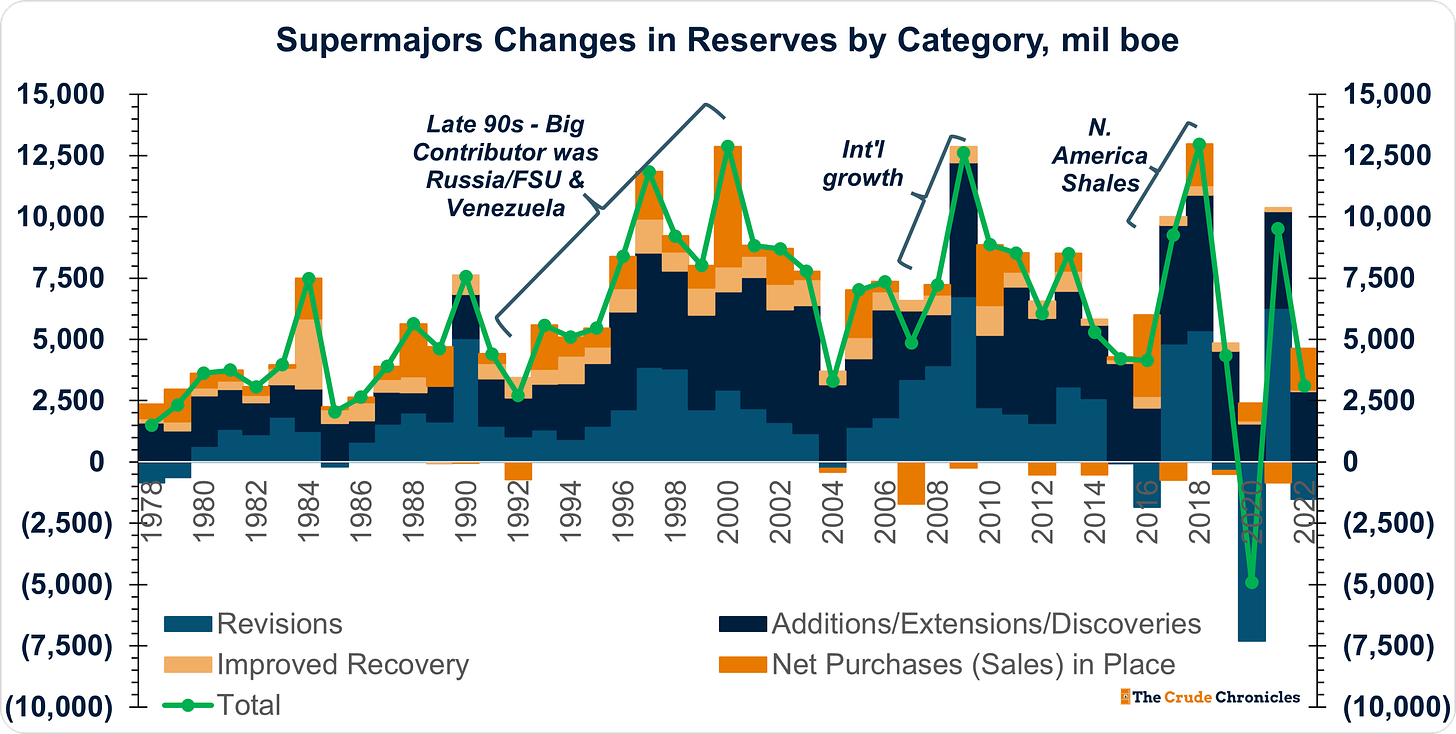
In terms of production, these recent mergers are nowhere near the 1990's/2000s narratives that are often pitched.
Sure, PXD adds ~700k boe/d of production but the Mobil deal doubled the size of the company.
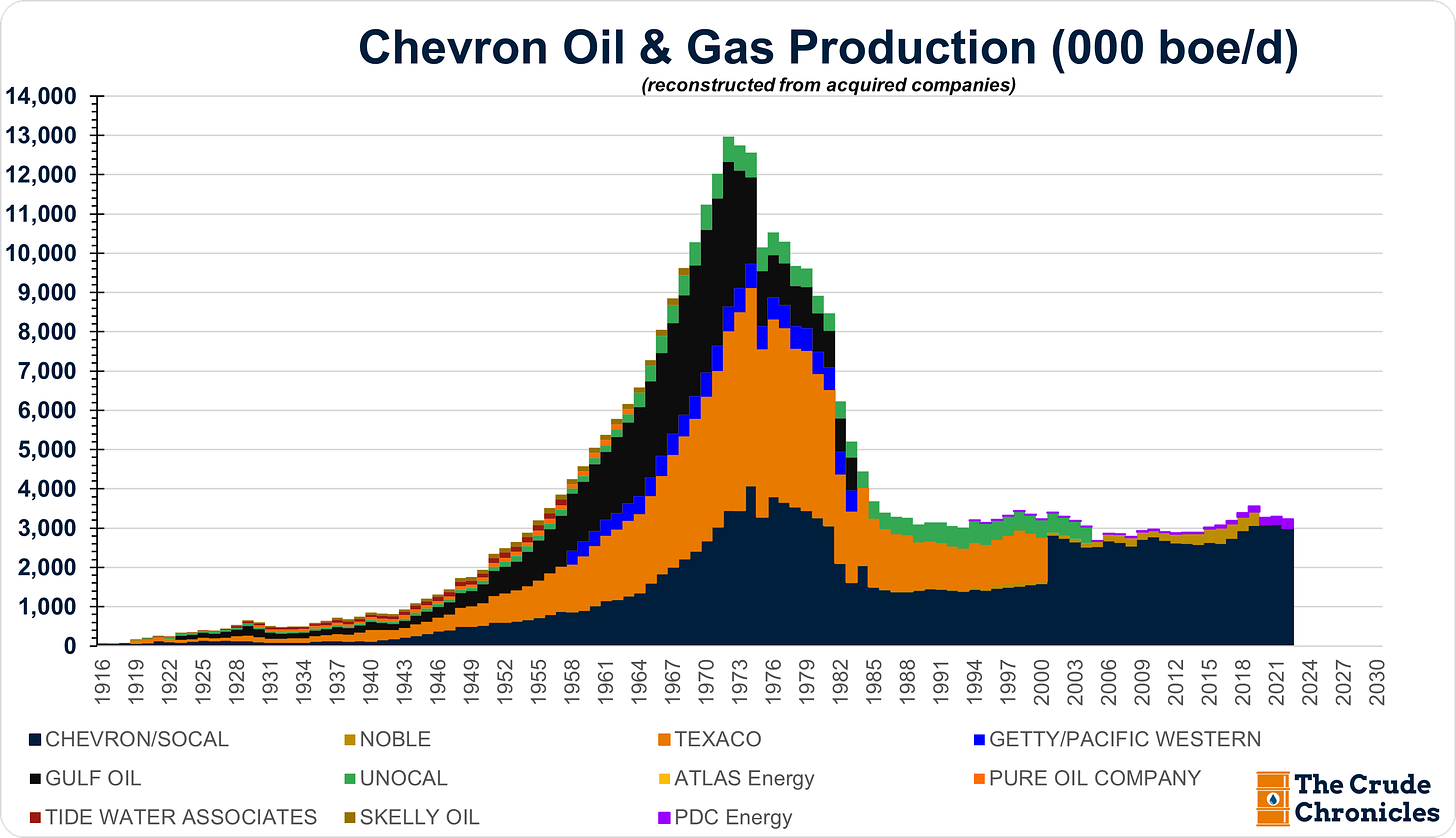
Same for the early 2000s Chevron deals
I could drop the charts to prove the same points for ConocoPhillips, BP and Total - if you want to see the charts just hit reply.
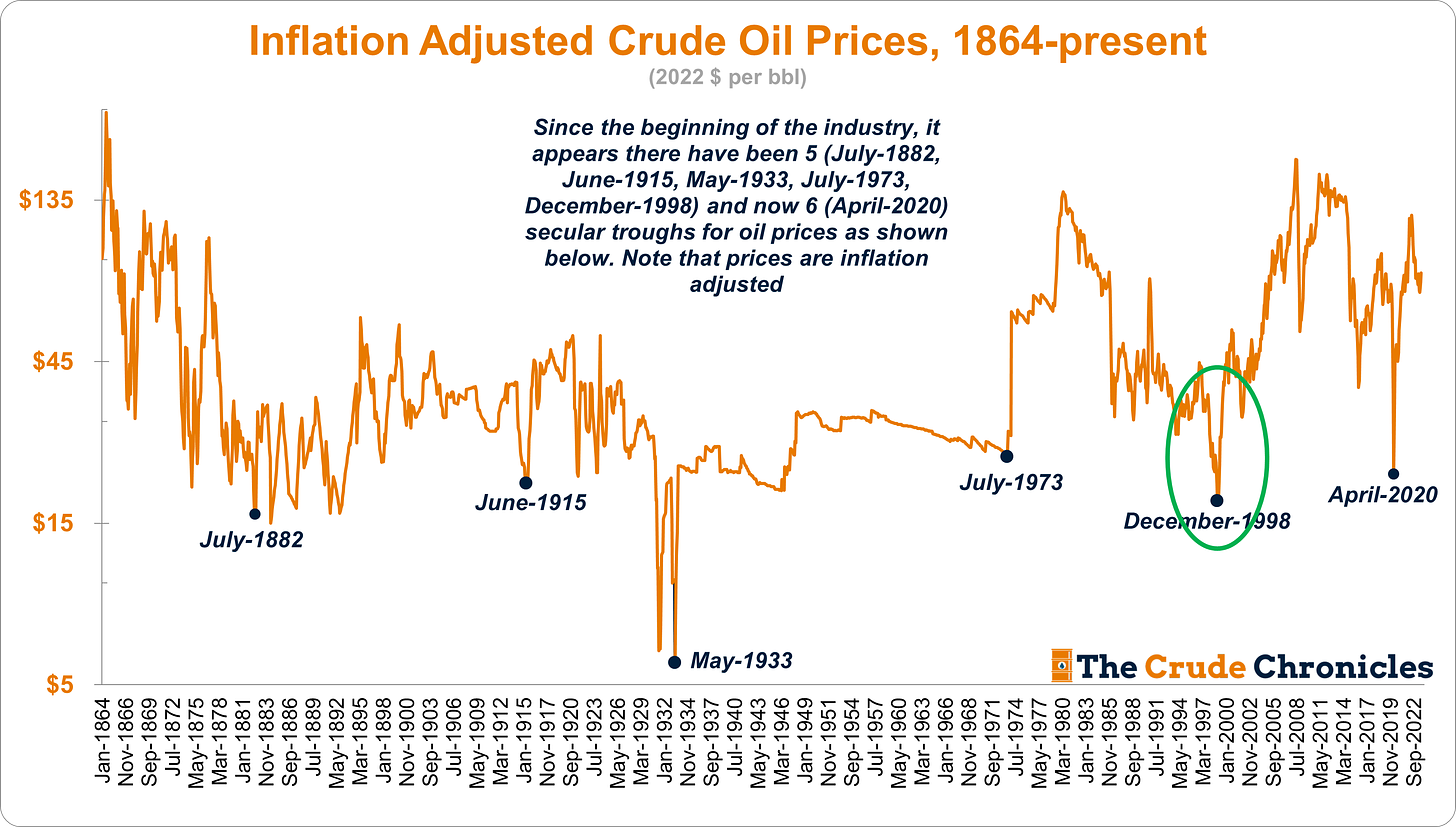
Those deals were done at the absolute trough of the cycle. The timing was AMAZING! We are closer to a third of the way through this cycle - see chart pack.
The Supermajors were adding scale but they were also taking advantage of the geopolitics of the time. Russia was imploding via a debt crisis and Venezuela and PDVSA were once thought of as the best-run NOC. The supermajor took advantage of the situation to add reserves.
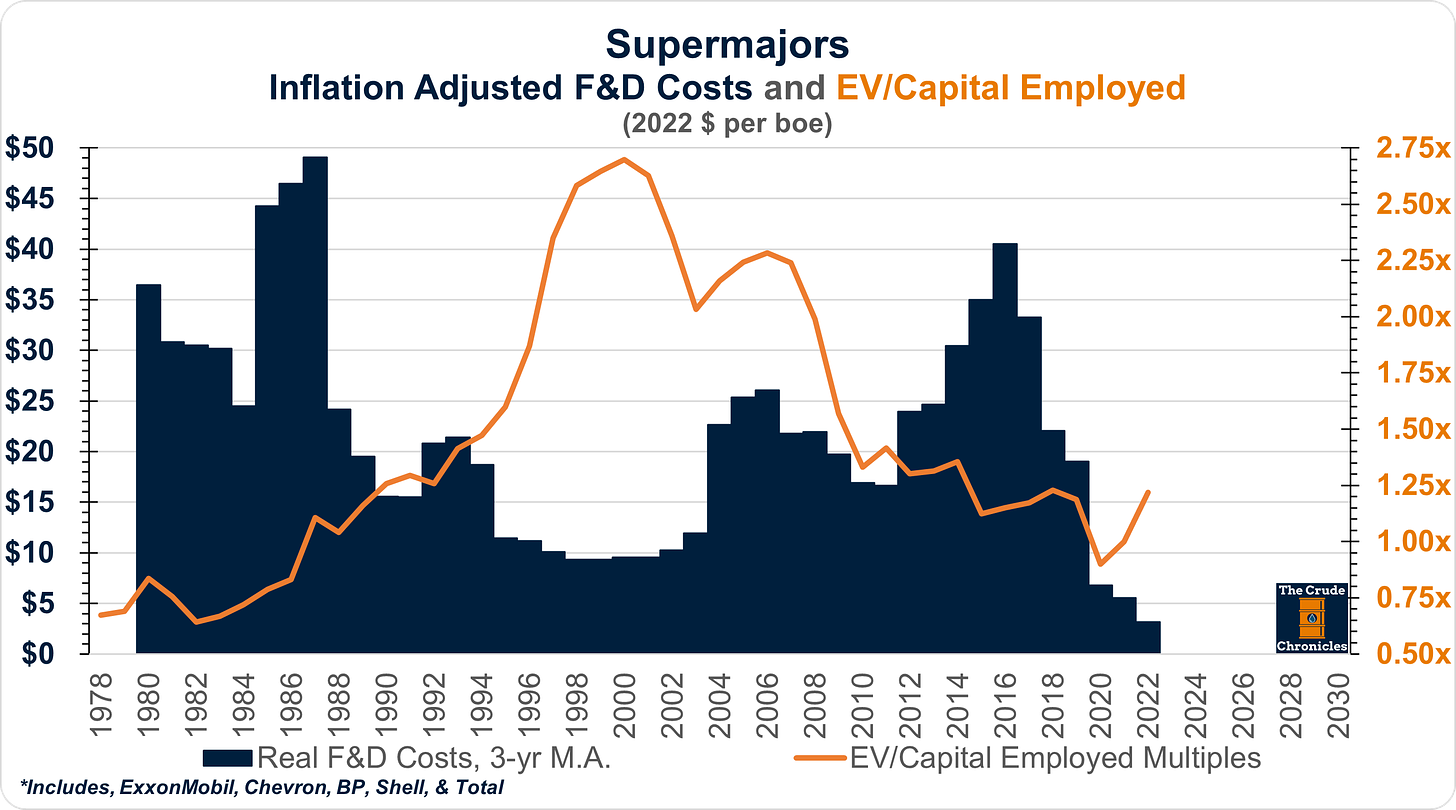
And they did so at very favorable finding & development numbers. In return, they were rewarded with high multiples relative to the capital they were putting on the books.
They started to add high-cost reserves in the late 2000s & 2010s and the market adjusted compressing the multiples. You can tell from the above chart that the market has been liking what it is seeing as of late but we will see how the 2023 reserve numbers shake out when XOM discloses 10ks.
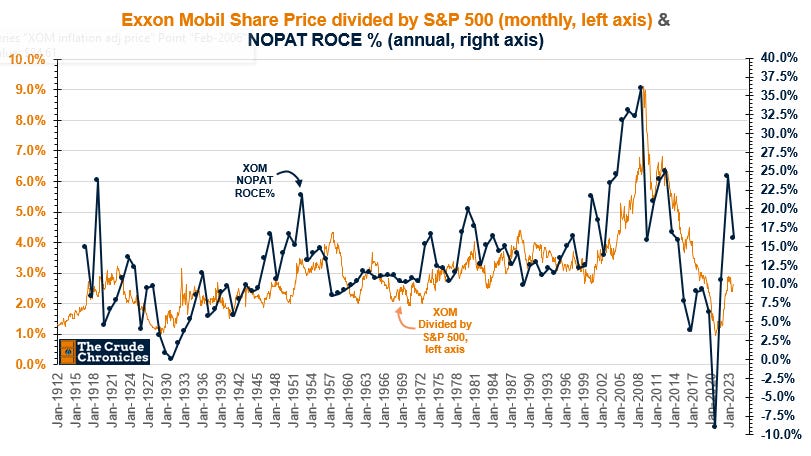
For 111 years XOM outperforms the broader market when ROCE is rising and vice versa.
The cycle largely determines the numerator and management decisions on what to do with the capital that comes in the door determine the denominator.
The 2000s was the perfect setup - cheap capital (i.e. low F&D) on the books and China in the driver's seat on the oil price side of things.
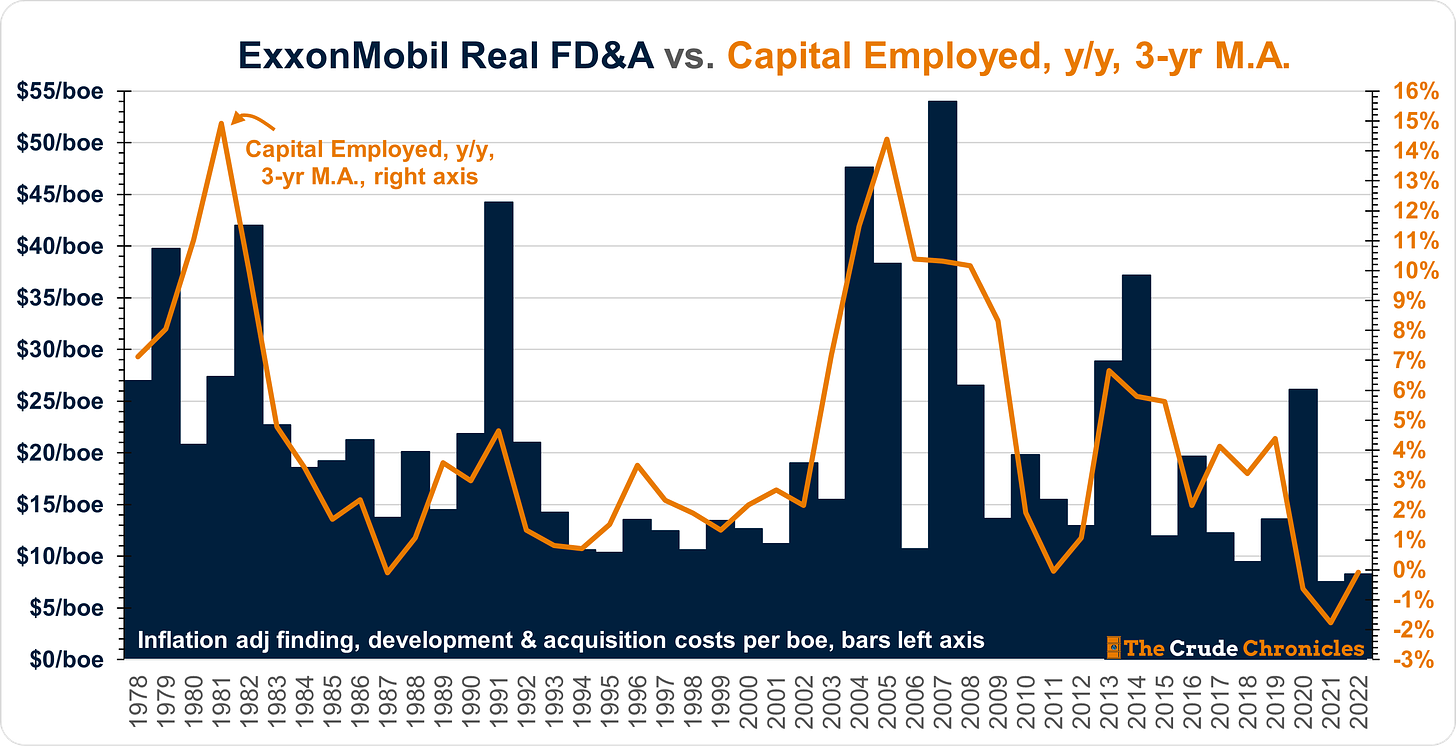
F&D gives us a look at where the denominator or capital employed is headed.
The $60B price tag that WSJ put on the deal divided by 2.4B boe of reserves (majority classified as developed) put the F&D at ~$25/bbl. Not a steal like Denbury or PDC but not egregious like XTO.
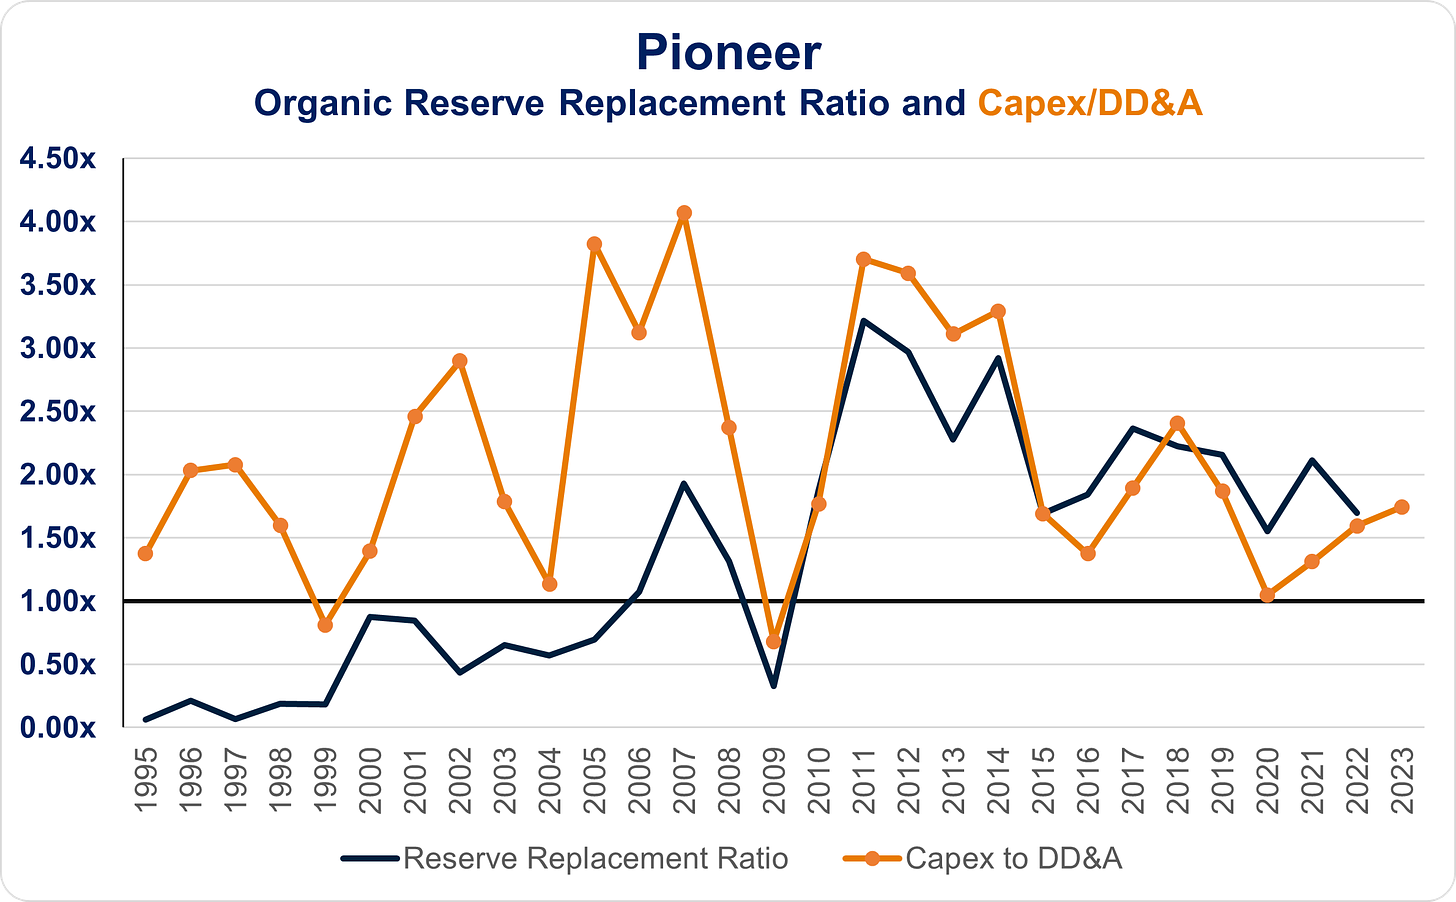
That $25/bbl is most likely a stale number and a bit high (ie latest reserves low) because Pioneer has always had an organic reserve replacement ratio higher than 1.0x and 1H23 capex/dda has been growing as well.
Again, back of the envelope, 30 minutes before I hit publish on the post.
Feedback and comments are greatly appreciated!
-CC
Disclosure & Terms of Use
Nothing in this content should be considered personalized financial advice or a solicitation to buy or sell any securities.
The content provided here is for informational purposes only. You should not construe any information or other material as investment, financial, tax, or other advice. The views expressed by The Crude Chronicles LLC are solely their own. Nothing in this content constitutes a solicitation, recommendation, endorsement, or offer to buy or sell any securities or other financial instruments in any jurisdiction. Please consult your own investment or financial advisor for advice related to all investment decisions.
Terms of Use: Paying subscribers are permitted to use these charts for their own use (i.e. sharing internally or within published research to external clients) provided proper sourcing is used. Please source as "thecrudechronicles.substack.com"


