
Yogi Barrel-ism

The Gist: We update our oil price vs. marginal cost model to add the fourth factor of Central Bank policy in response to higher energy prices. Fair value for oil is still $80. The floor (-1 standard deviation vs. marginal cost) is ~$70/bbl.
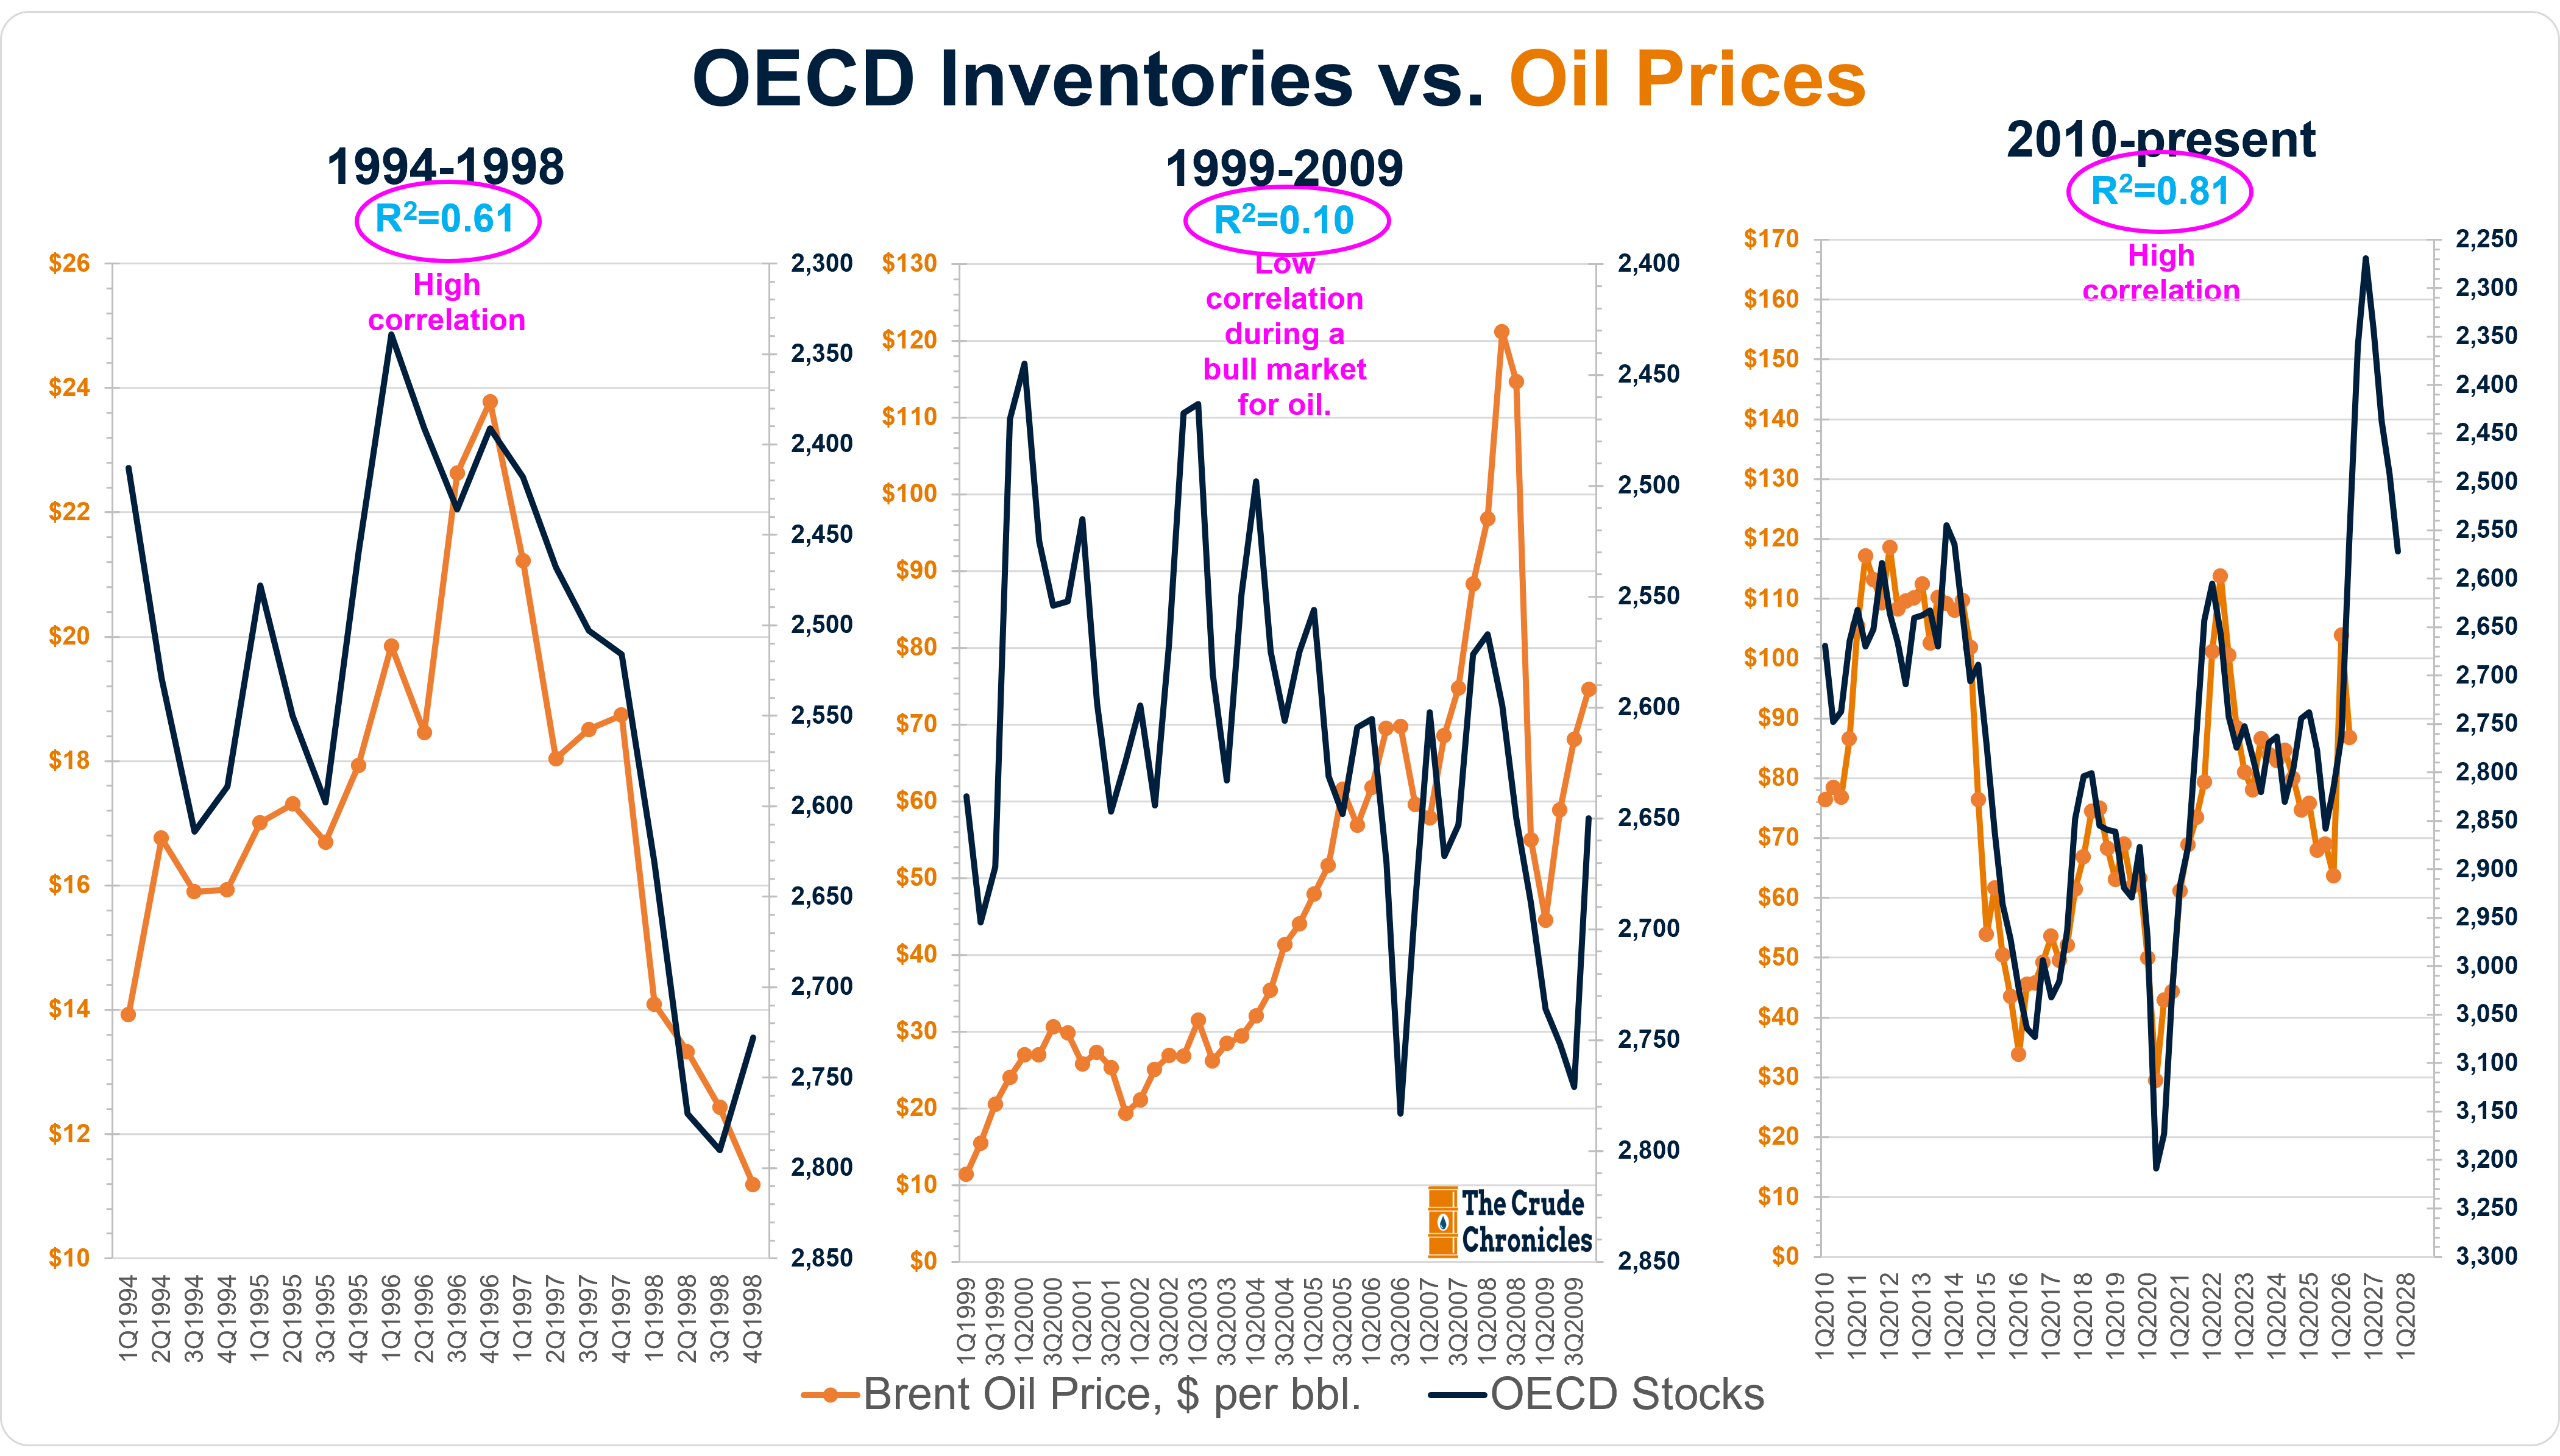
The model that consensus uses—based on inventories versus price—suggests that oil should be trading north of $160/bbl.
However, as Yogi Berra famously said, “It’s tough to make predictions, especially about the future.”
We’re not sure what Mr. Berra had in mind—but he might as well have been talking about oil markets.
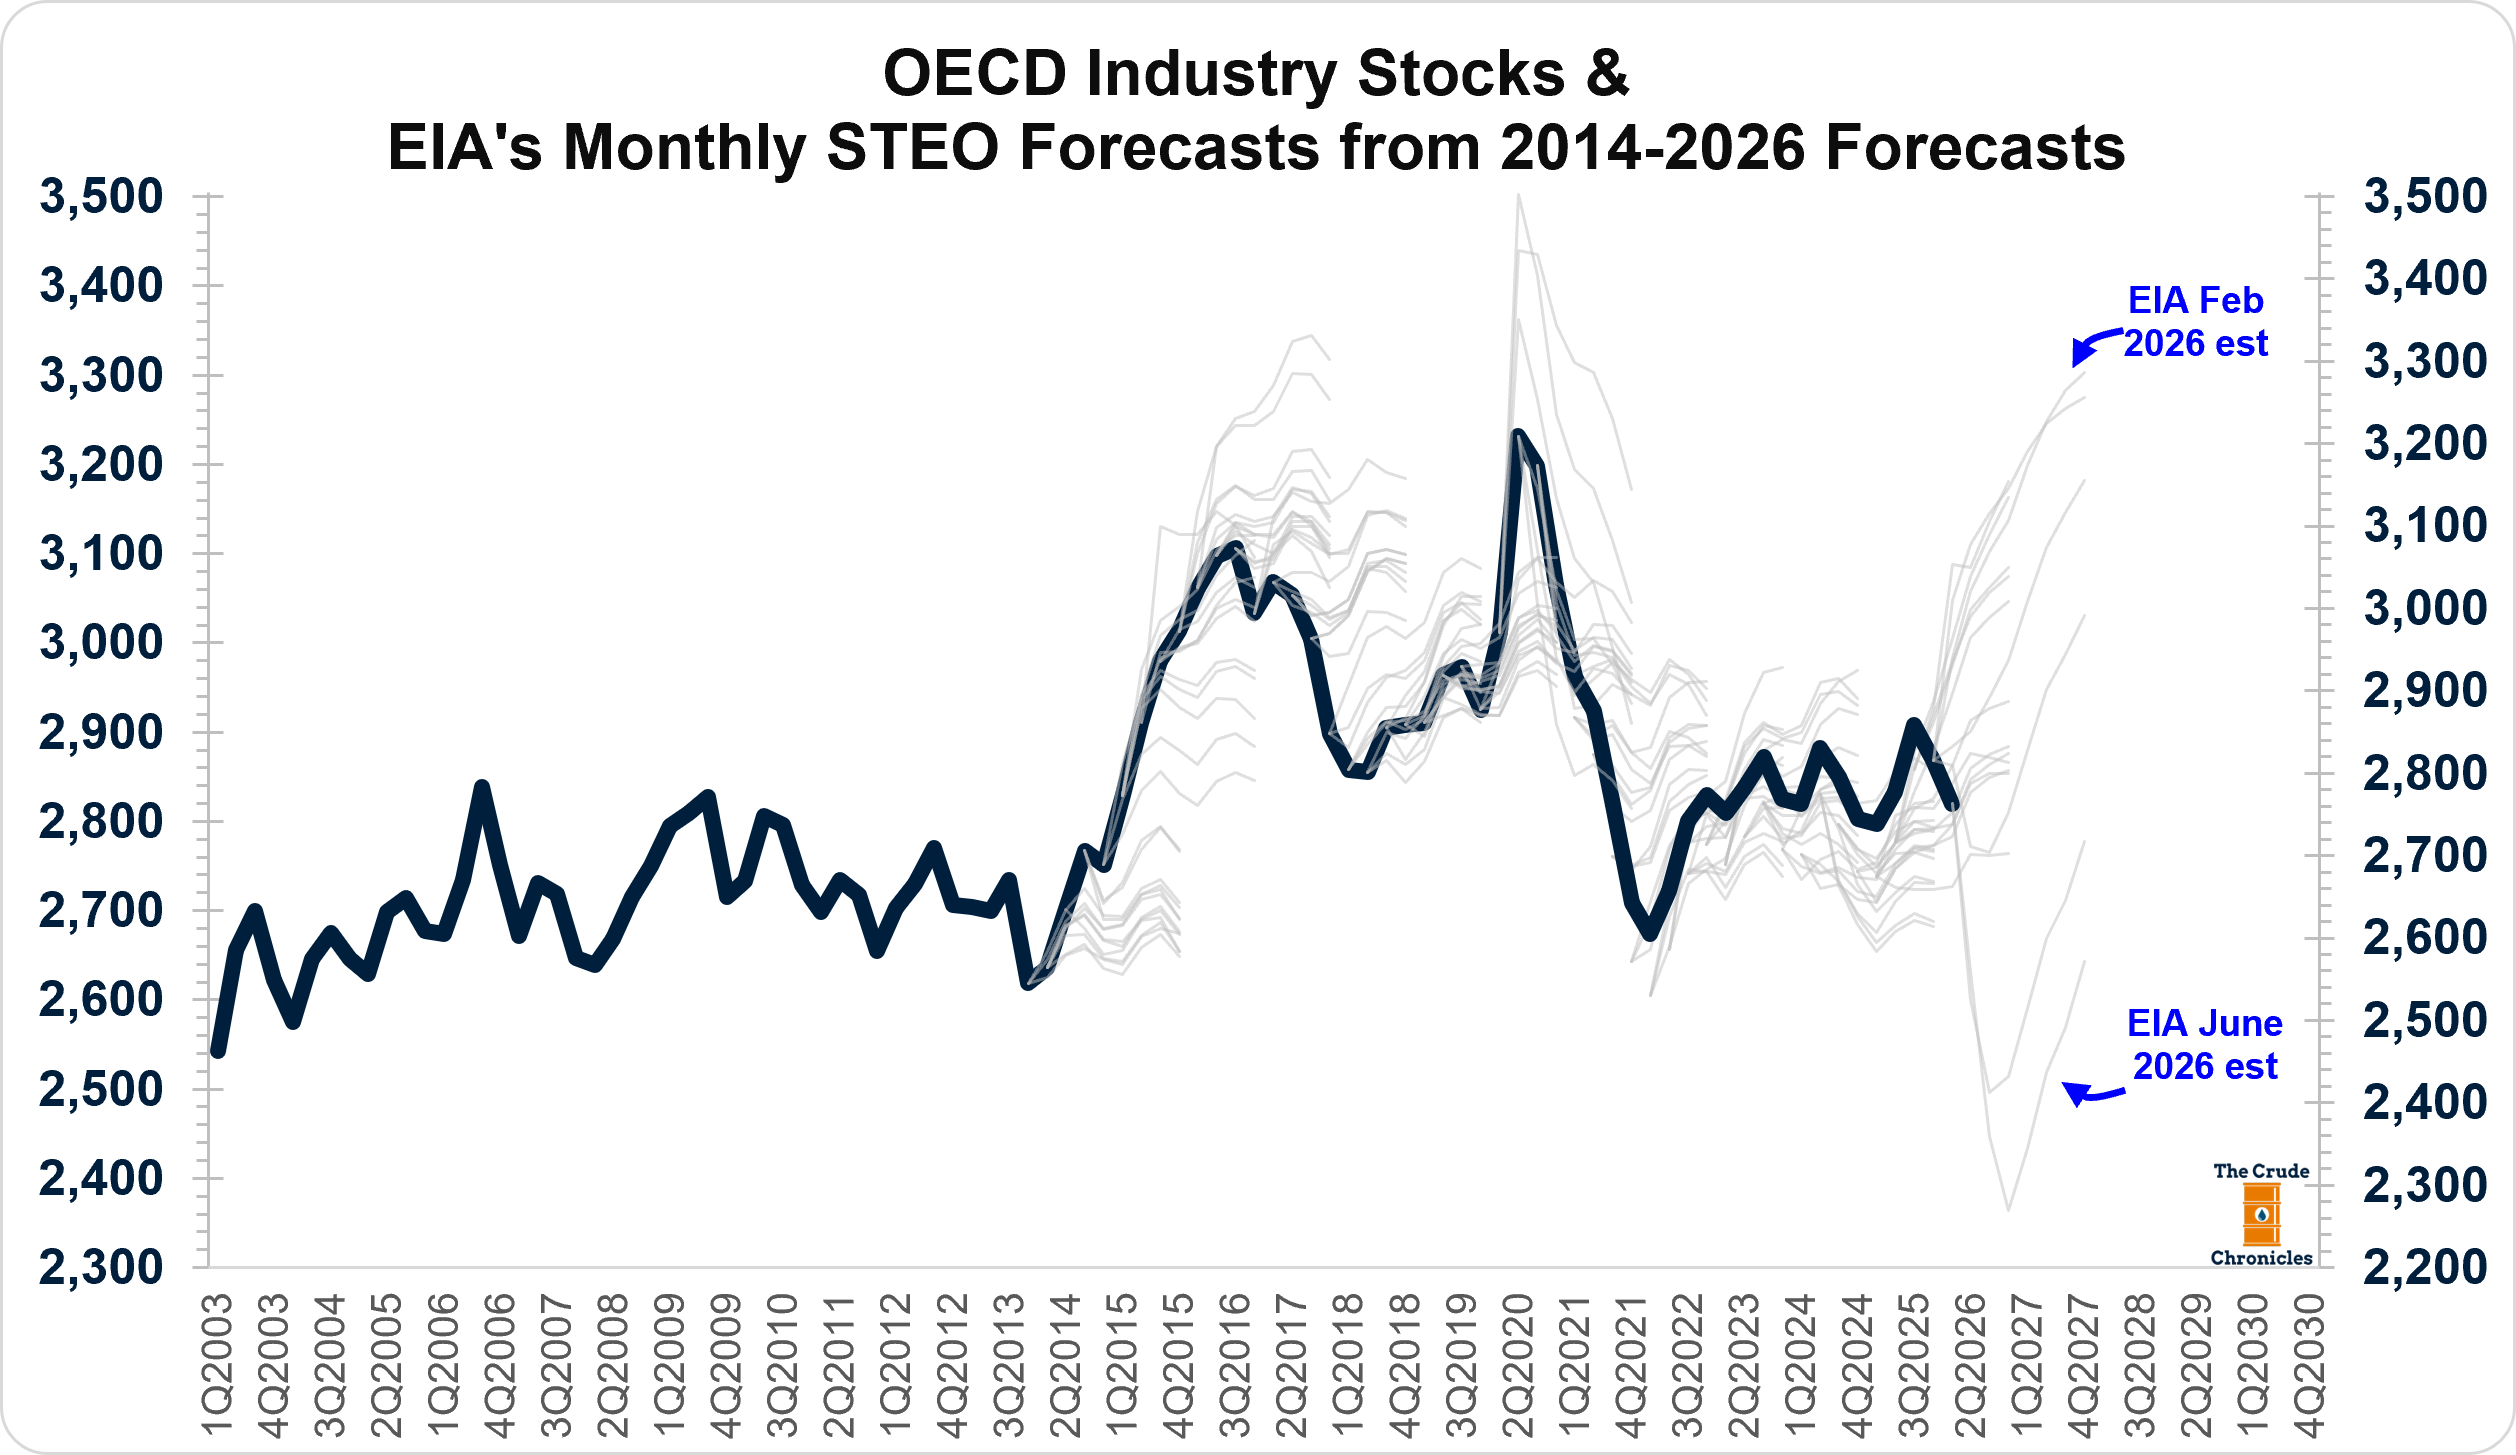
The chart below illustrates this point. The faint grey lines show the EIA’s forecasted path for OECD inventories at various points in time going back to 2014, while the thick black line shows what actually occurred.
It’s clear that forecasts rarely match reality.
This isn’t because the major agencies (EIA, IEA, OPEC) and investment banks lack the mental capacity. Their SAT scores almost certainly put mine to shame—the same scores that got me into a state school… Go Terps!
Too often, these forecasts—relied upon by so many market participants—fail to take the next step:
If supply, demand, and inventories evolve along a predicted path… how will participants react?
Soros famously called this reflexivity.
You can also think of markets as a complex adaptive system—a network of participants (producers, traders, governments, consumers and yes, even Twitter/X commentators, and Substack writers) who interact, learn, and adapt in response to one another.
The result is we can’t simply analyze supply and demand in isolation.
This system becomes most apparent at the extremes—and we’ve seen plenty of those in a short period of time.
Our framework focuses on price vs. marginal cost, and it does an excellent—arguably the best we’ve seen—job at explaining long-term oil price trends (HERE). But it’s not perfect.
In the short run, it offers only a wide range of possible outcomes, not a precise path but we can use it to find when we are at the extremes.
