The Gist: (1) This has been the 3rd strongest Presidential Cycle in history for O&G equities since 1912. (2) Energy equities historically have shown a preference for a Dem/Dem White House/Congress combo but this may be due to the fact that it has also been the most frequent combination. (3) The jury is still out on which party taxes the oil industry more. Investment cycles are evenly split between the 2 parties. This analysis is fun but the productivity cycle is what really drives oil.
Ever get curious about how the whole oil, energy stocks and U.S. politics all mix together?
Buckle up, because in this post we are getting into the data.
But ditch the political jerseys for this one – we're all about the history.
This current presidential term for energy stocks has seen the third strongest performance dating back to 1913!
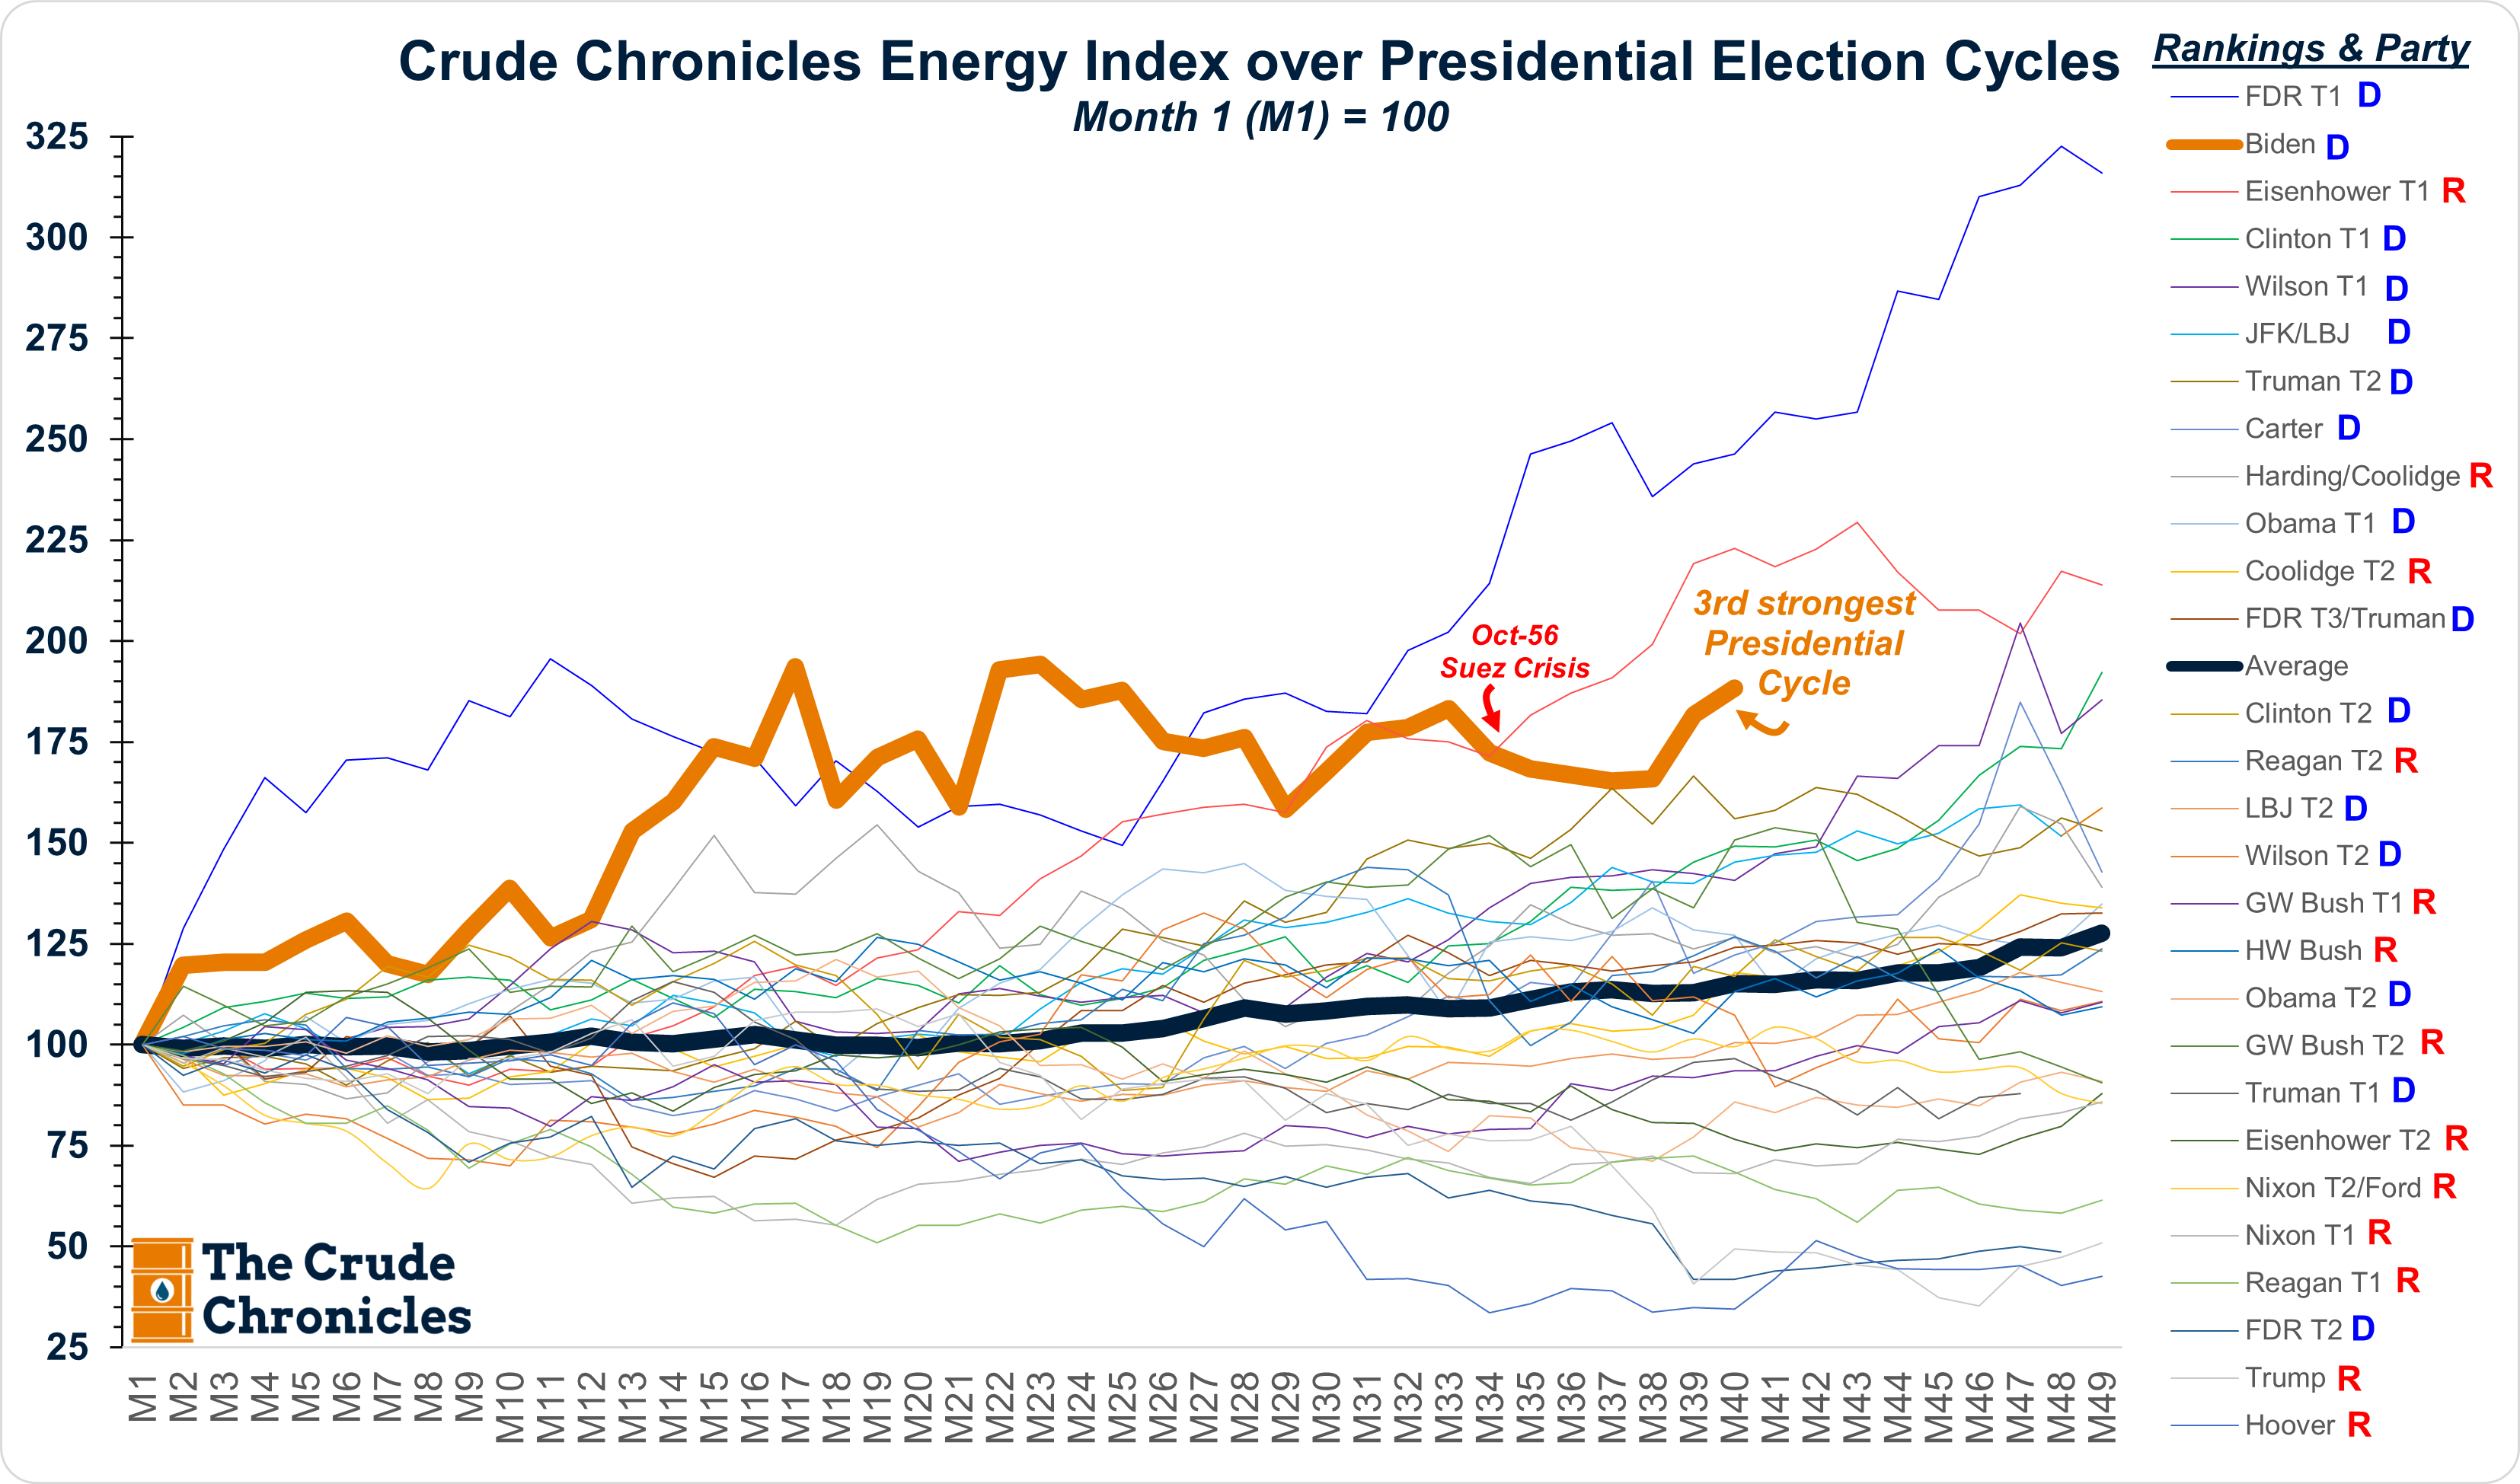
For quite some time it was one of the top two but fell behind Eisenhower’s first term after the 1956 Suez Crisis broke out.
Now, some folks might say it's just because the world is getting back on its feet after that whole COVID thing.
However, if you were to examine the right side of the chart, I rank all the Presidential Cycles from Top Performance (FDR’s 1st term down to Hoover’s).
You will clearly see the Dem’s tend to fall above the average while the Republican Presidential Cycles are below the average.
History has shown, energy stocks have tended to do better when there's a Democrat in the White House.
Let’s dissect the thick black average line a bit vs. the current cycle in the chart below.
Listen to this episode with a 7-day free trial
Subscribe to The Crude Chronicles to listen to this post and get 7 days of free access to the full post archives.