ROCE North of the Border
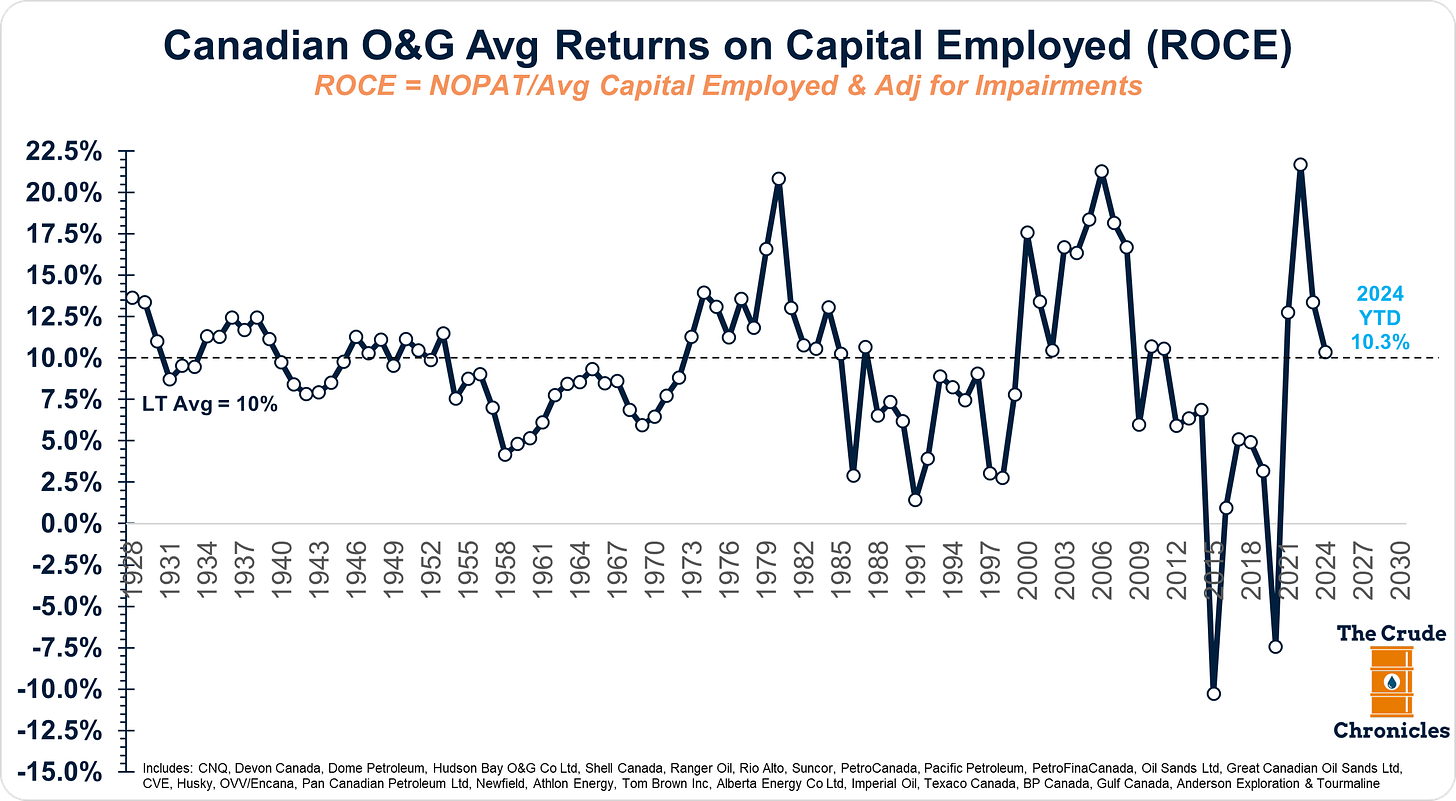
The Gist (1) The major Canadian O&G companies exhibited an average return on capital employed (ROCE) of 10.3% for 1H24, in line with the long-term average.(2) Canadian O&G firms are winning the ROCE race by a narrow margin compared to the Integrated Oil and U.S. E&P sectors. (3) Imperial led the way, while OVV lagged behind.
The dog days of summer are coming to an end, and I am using the remainder of August to wrap up some updates on return on capital employed (ROCE).
Today, we have a recap of annualized ROCE for our friends north of the border in Canada.
For a recap of the integrated oils, see HERE, and for the U.S. E&Ps, see HERE.
What immediately stands out is that Canada’s major publicly traded oil & gas companies delivered a 10.3% return on capital employed (ROCE) for the first half of 2024, in line with the last century’s average ROCE of 10%.
ROCE is influenced by two factors.
The cyclical ROCE fluctuates with the natural business cycle.
The secular ROCE is influenced by longer-term investment cycles.
High returns attract more investment, which in turn suppresses long-term returns. This was the case from 2006 to 2020.
However, as the chart below shows, asset replacement rates, as measured by Capex/DD&A, are hovering around 1.0x, which is below any sort of long-term average.
Keep reading with a 7-day free trial
Subscribe to The Crude Chronicles to keep reading this post and get 7 days of free access to the full post archives.


