


There are 6 stages within each offshore cycle and the history of Transocean shows them all.

Nine months ago, when I began the process of putting together this history on Transocean I came to realize that the history of RIG 0.00%↑ is the history of the offshore industry.
This is because so many of the companies that were rolled up in the late 1990s & 2000s can trace their origins to the early days of offshore and were once major players themselves.

RIG’s origins begin in the early 1950s when a utility named Southern Natural Gas Company (later SONAT) established a business properly named “The Offshore Company” with just one rig to find gas in order to supply its utility business.
Fast forward to the 1990s and a series of transactions would take place that would leave an energy investment banking team foaming at the mouth.
Sonat Offshore was IPO’ed and merged with Transocean ASA, adopting the latter’s name.
R&B Falcon was acquired, itself a product of a merger between Reading & Bates and Falcon Drilling.
SEDCO, the offshore drilling unit of Schlumberger was acquired.
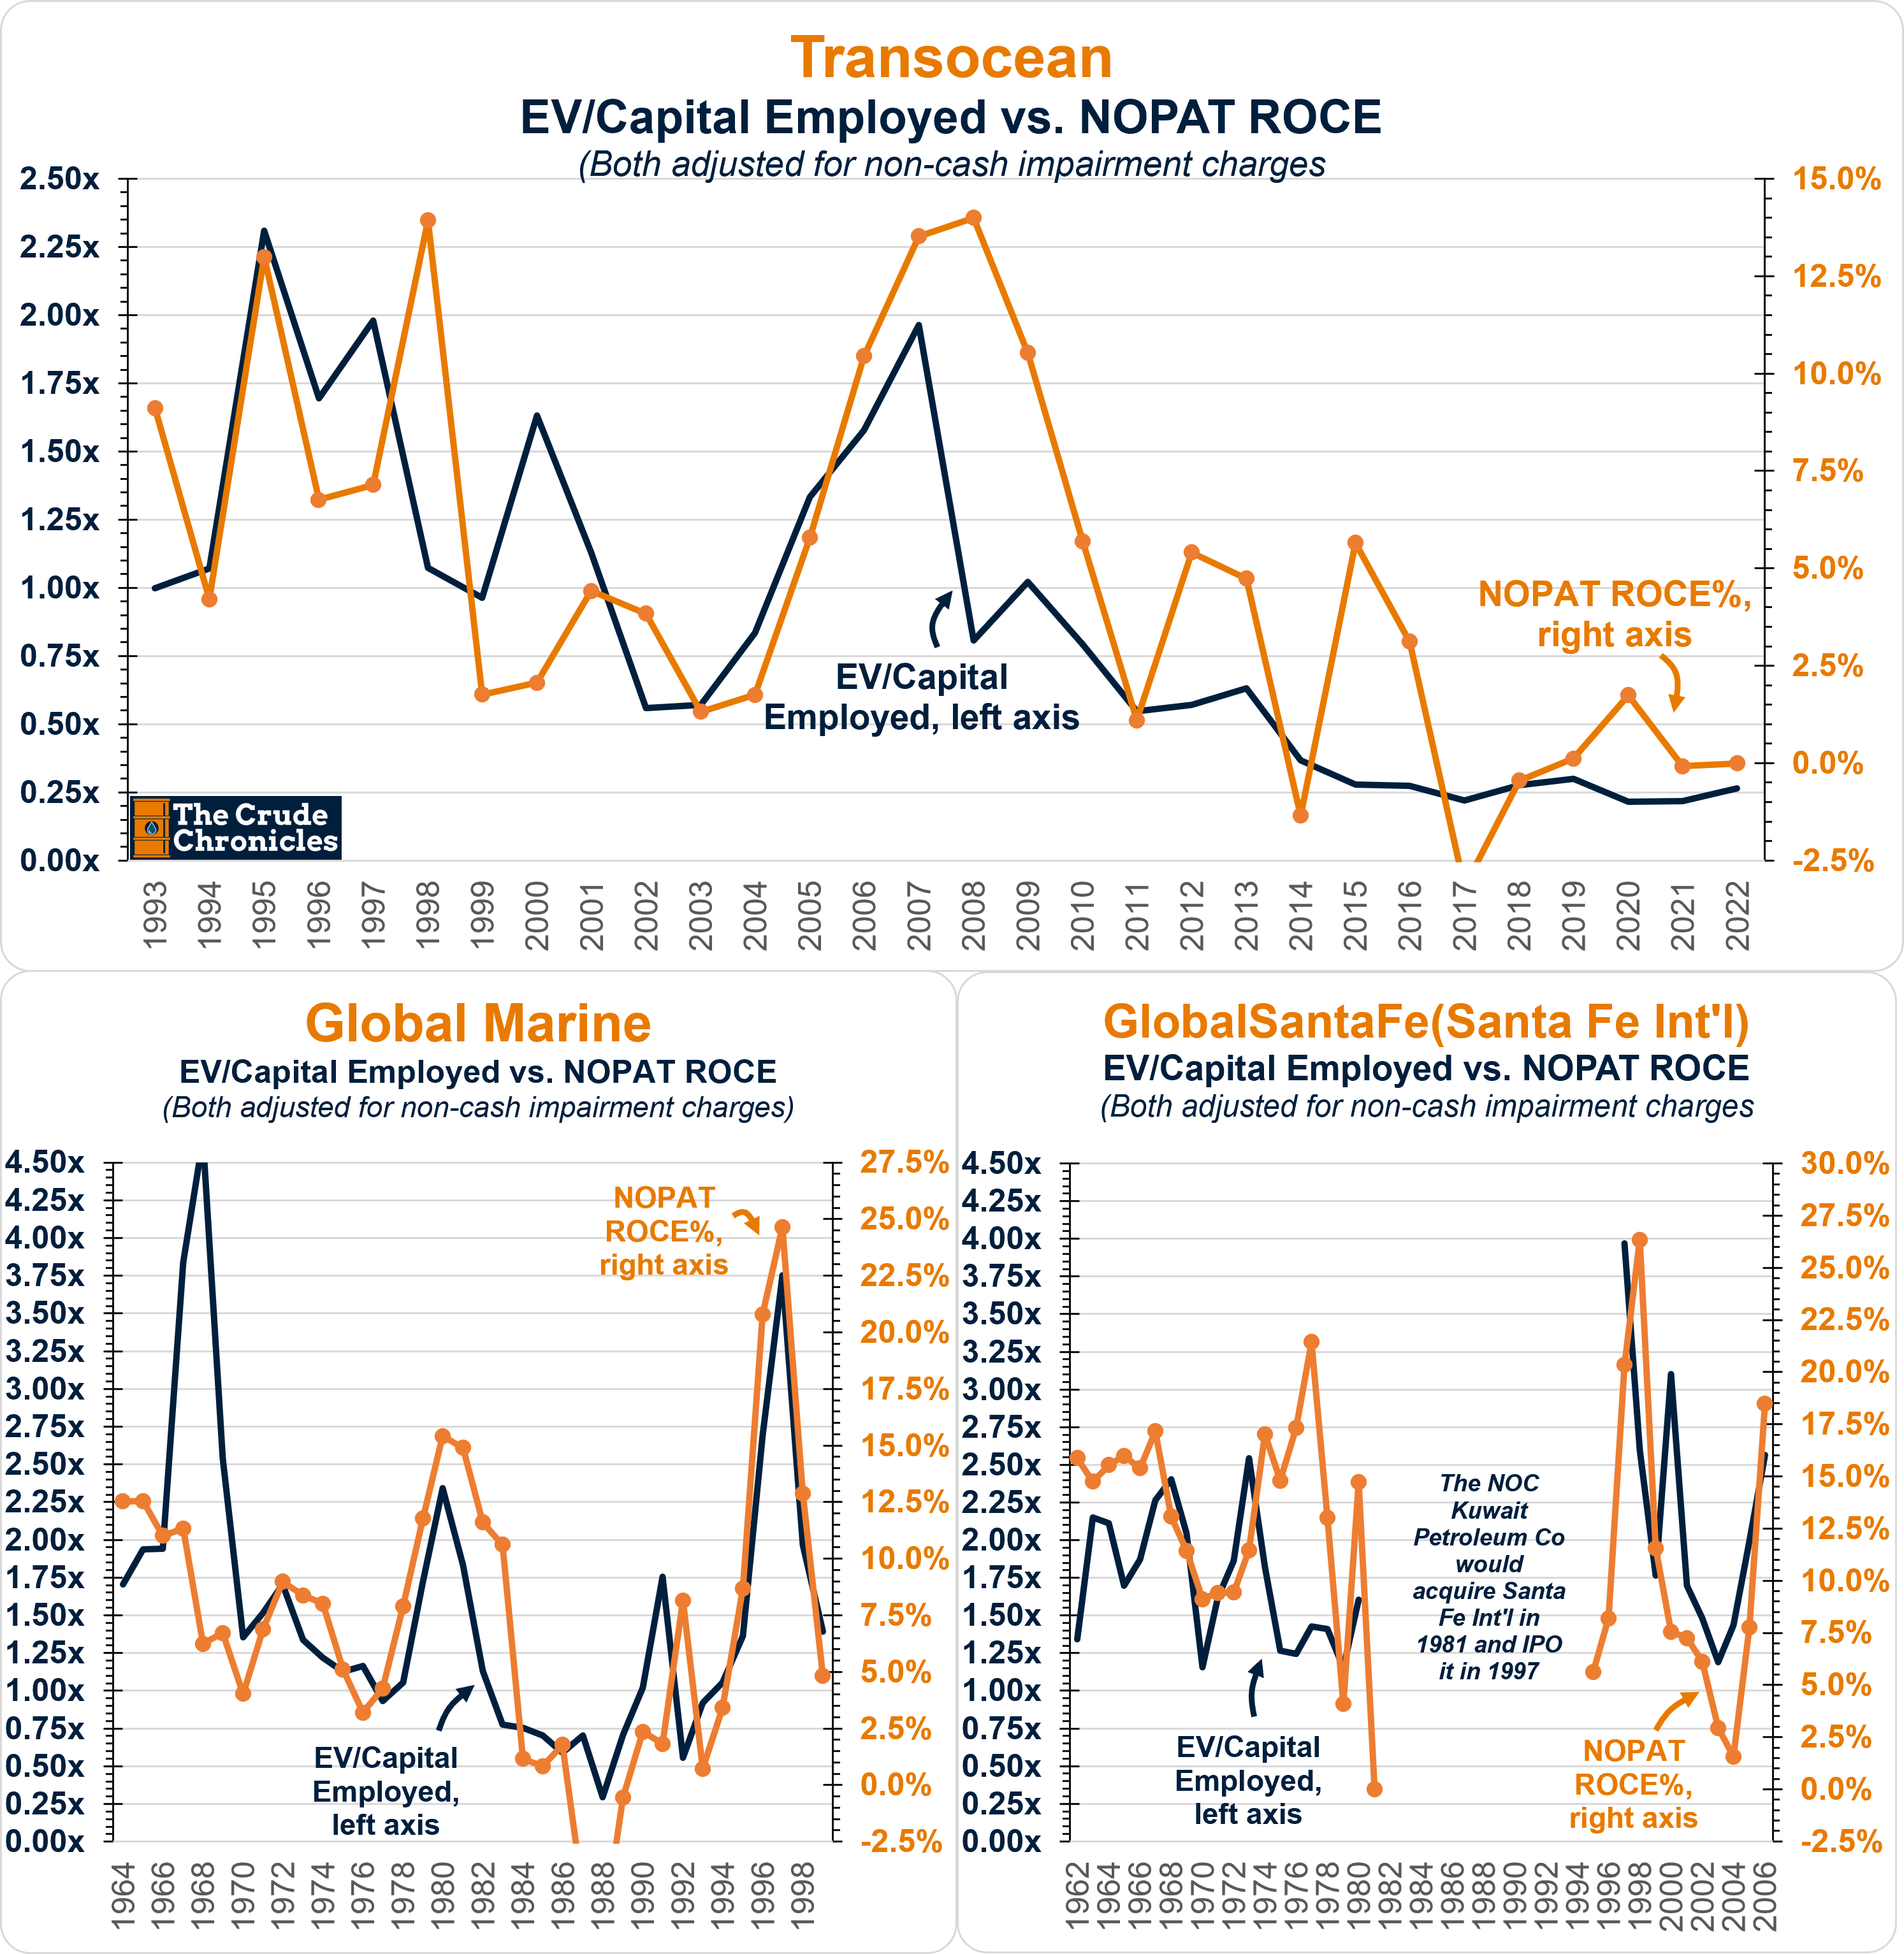
And finally, in a classic “ringing the bell at the top” there was the 2007 acquisition of GlobalSantaFe. GSF was itself a combination of the legacy offshore drillers Global Marine and Santa Fe International.
As a side note, this history was one of the most annual report-intensive ones I have ever put together to date. Dozens of annual reports were ordered, copied, and manually input into spreadsheets.
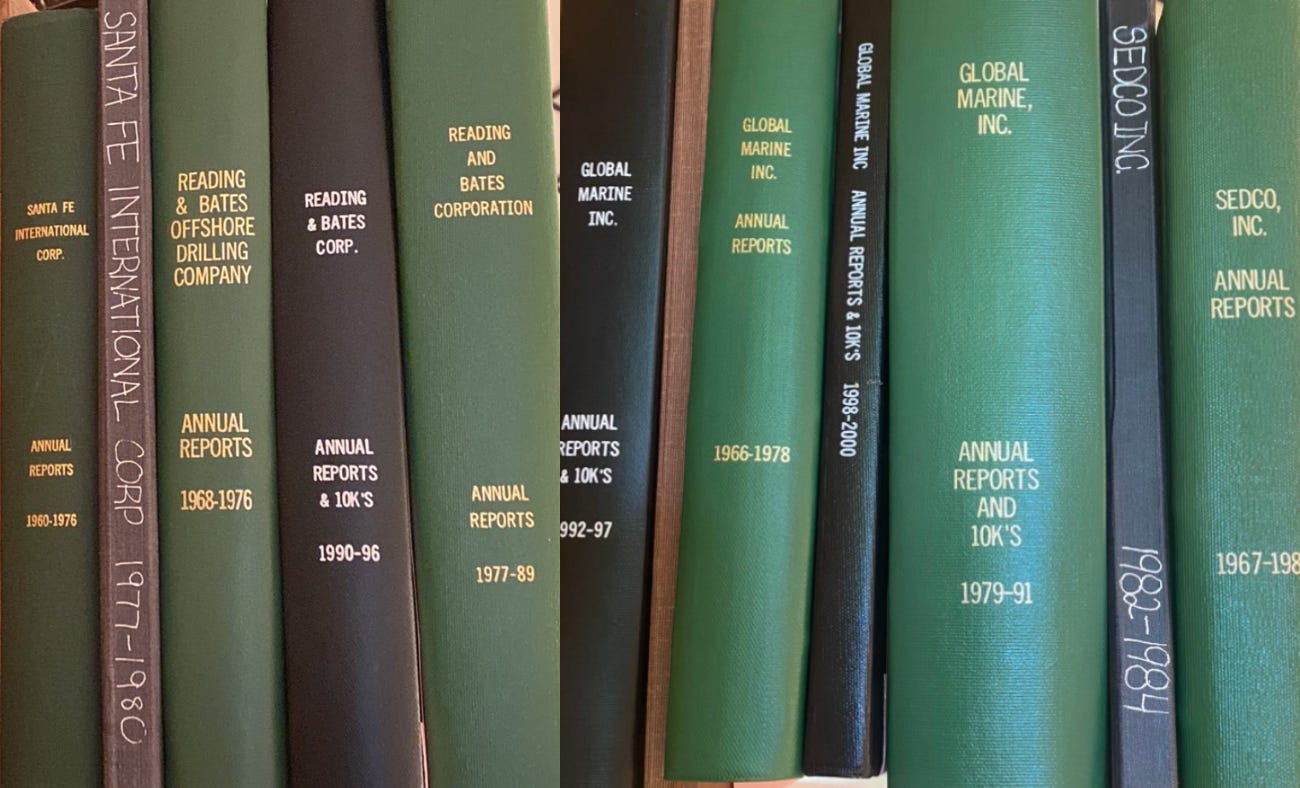
Every time I thought I was close to finishing gathering the data, I would find another company that was acquired.
By the time I finished, I realized that what I had was not just a history of Transocean but a history of the offshore industry.
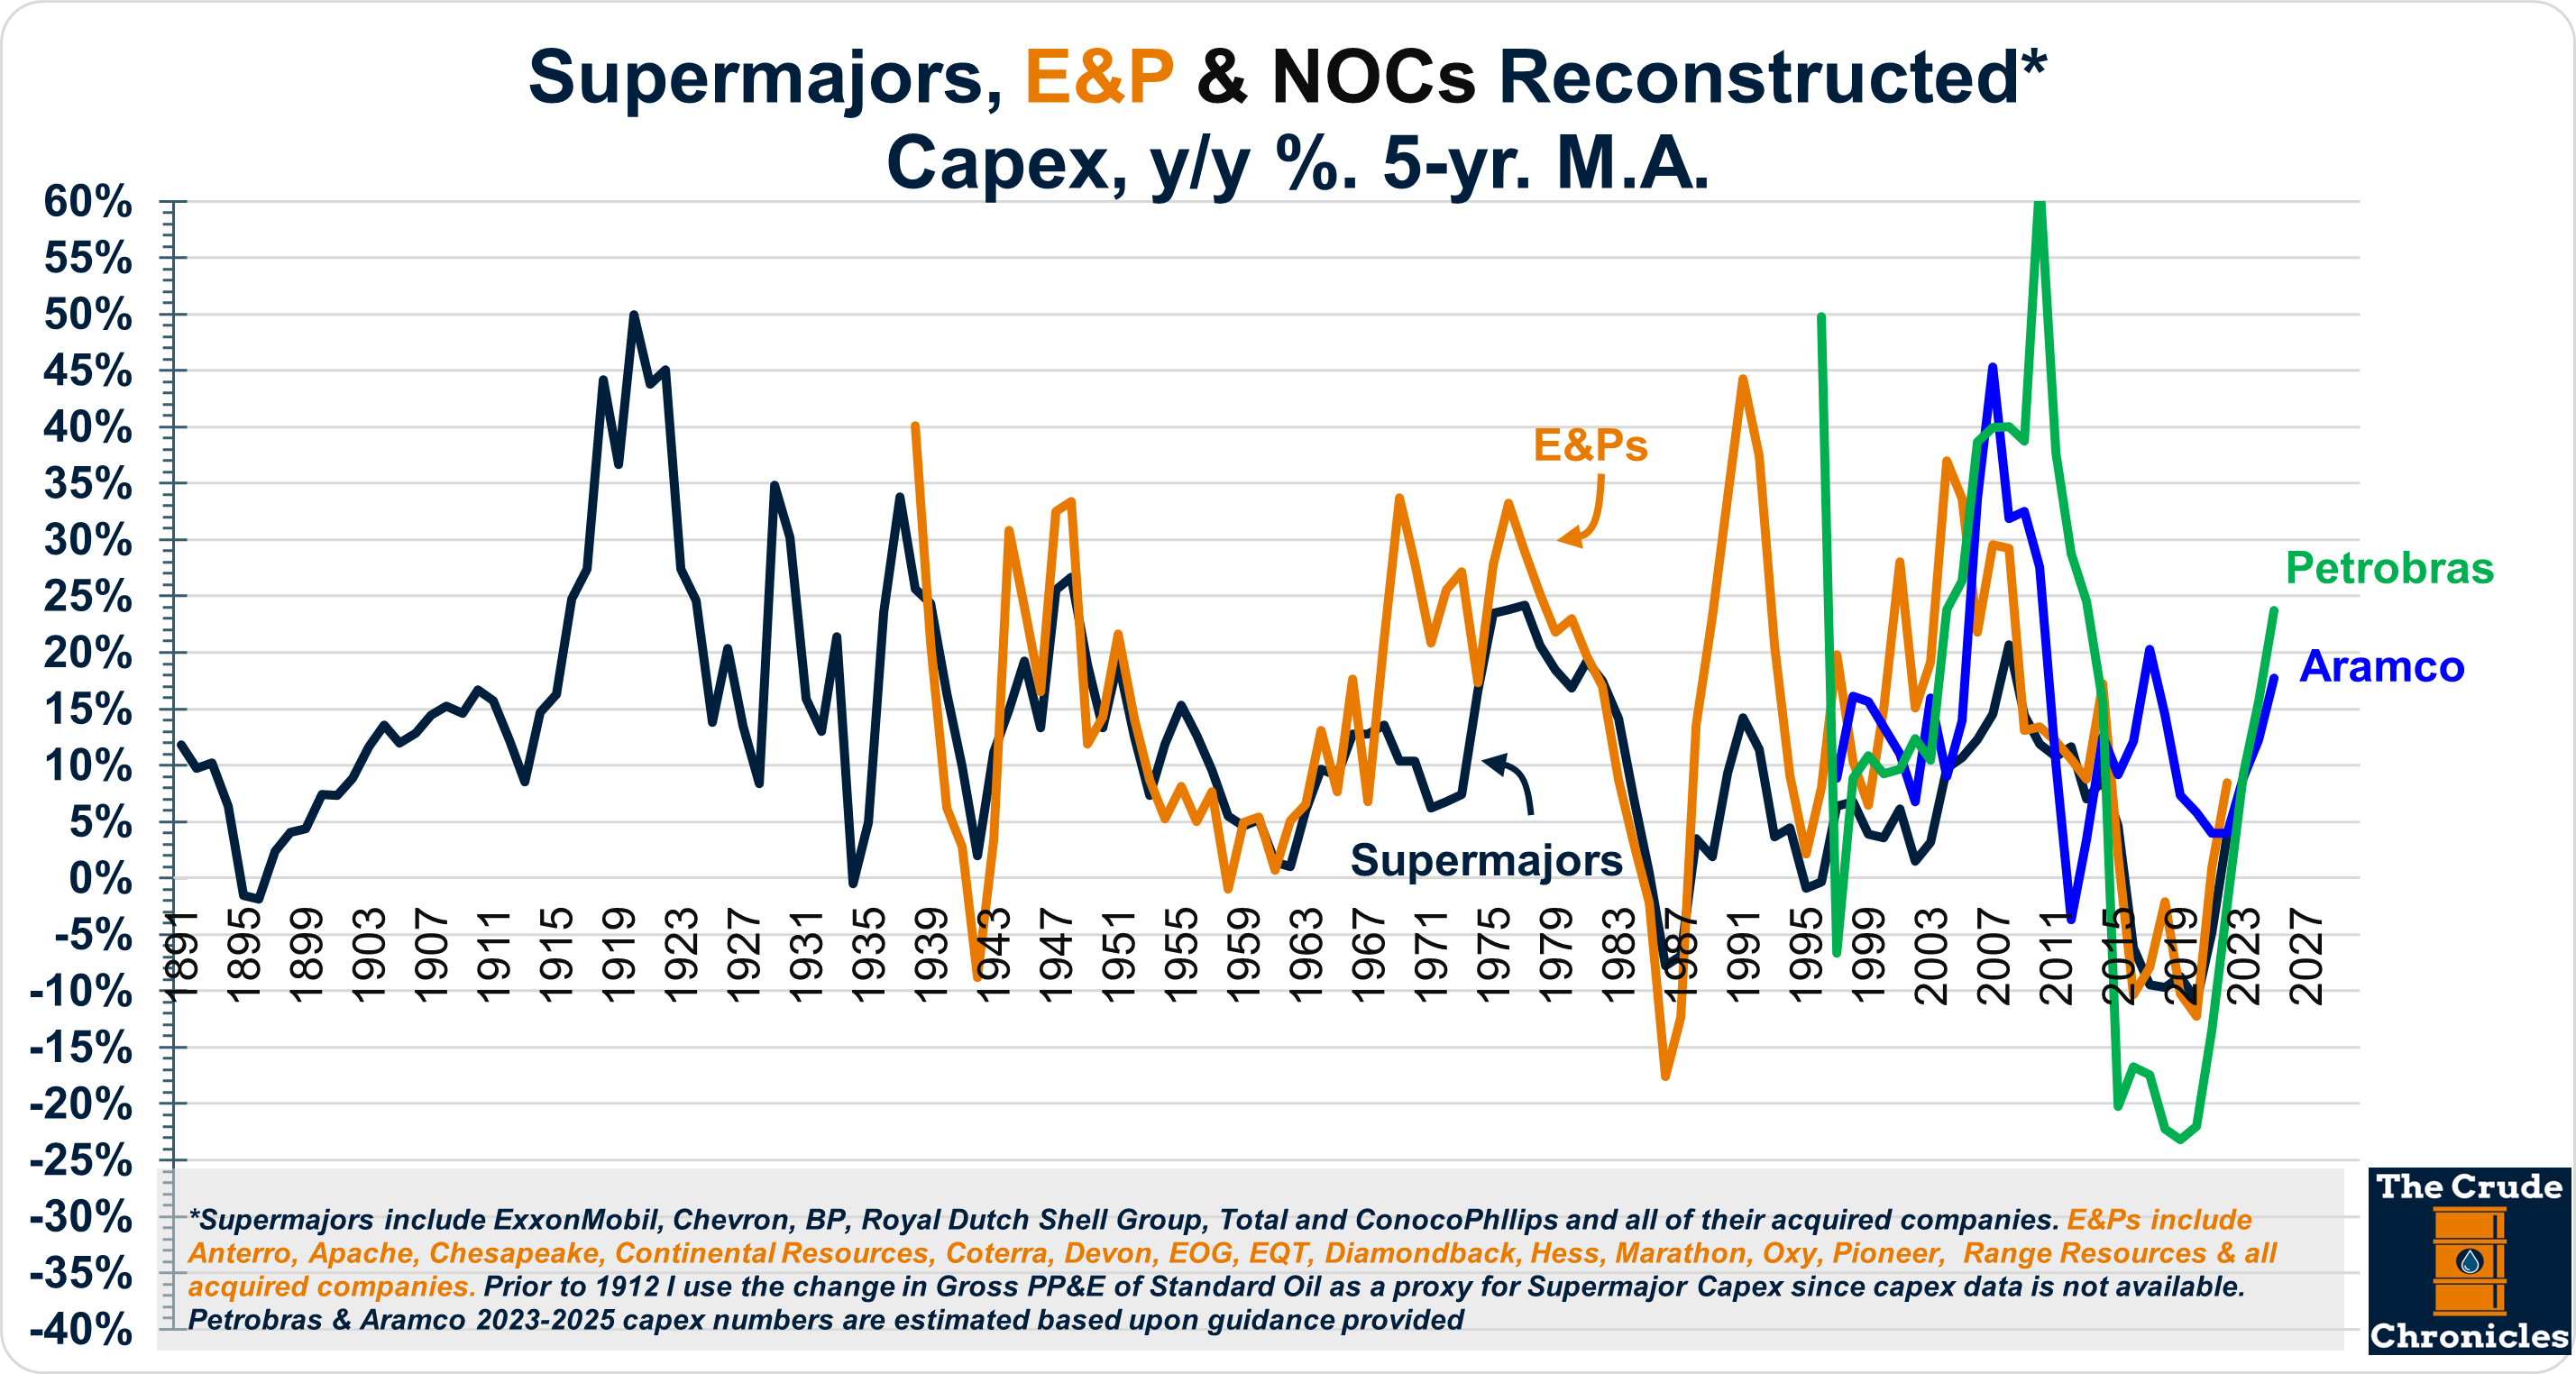
One of the reasons I think the offshore theme will make a comeback is that exploration budgets are now rising.

Shales caused exploration dollars to take a back seat to the other ways oil & gas companies allocated capital. Shales became a land grab with a focus on driving down development costs.
But with exploration now on the rise, you can see the biggest beneficiary has always been the offshore industry. (P.S. There I see a clear 1-2 year lead-lag in that chart)
Beginning in the 1950s, there have been 4 offshore cycles and if I am correct this will be the 5th. I have not named this one yet but if you have any ideas let me know.

In this post, I will show you how within each of these cycles there have been 6 stages to each. They are:
Offshore becomes competitive and attracts capital.
The boats are put to work and utilization rates improve.
Industry margins improve as both utilization and pricing rise.
The industry gorges itself on capex to replenish the fleet.
Utilization & margins begin to peak as new supply enters the market.
An industry-wide balance sheet recession begins followed by consolidation and recapitalization.
And the cycles repeat.
As a bonus, at the bottom is a section titled “the ‘multiple’ irony of the offshore industry.” And as always for paying subscribers, your weekly chart pack is included as well.
Let’s Begin.
Stage 1 - Offshore becomes competitive and attracts capital.
Energy prices are instrumental to the offshore industry but simply saying that offshore is tied to oil & gas prices is a lazy narrative in my opinion.
There are more nuances to it.
First, capital allocation to offshore projects has to become competitive with the other options an oil & gas company has.
This often occurs when the capital intensity of the latter begins to rise.
In fact, the beginnings of many of these offshore drilling companies can be traced back to the post-WW2 period when cost inflation was plaguing traditional L48 basins.
Then in the 1970s, the seeds of the cycle were planted when the Seven Sisters lost control of low-cost barrels in the Middle East and N. Africa and went to look to develop higher-cost reserves elsewhere, particularly in the N. Sea.

If you read my May 20 post (HERE), much of the international investment went to the North Sea (shown as Western Europe below).

Offshore capex in Latin America was booming as well.

And the Gulf of Mexico was growing.
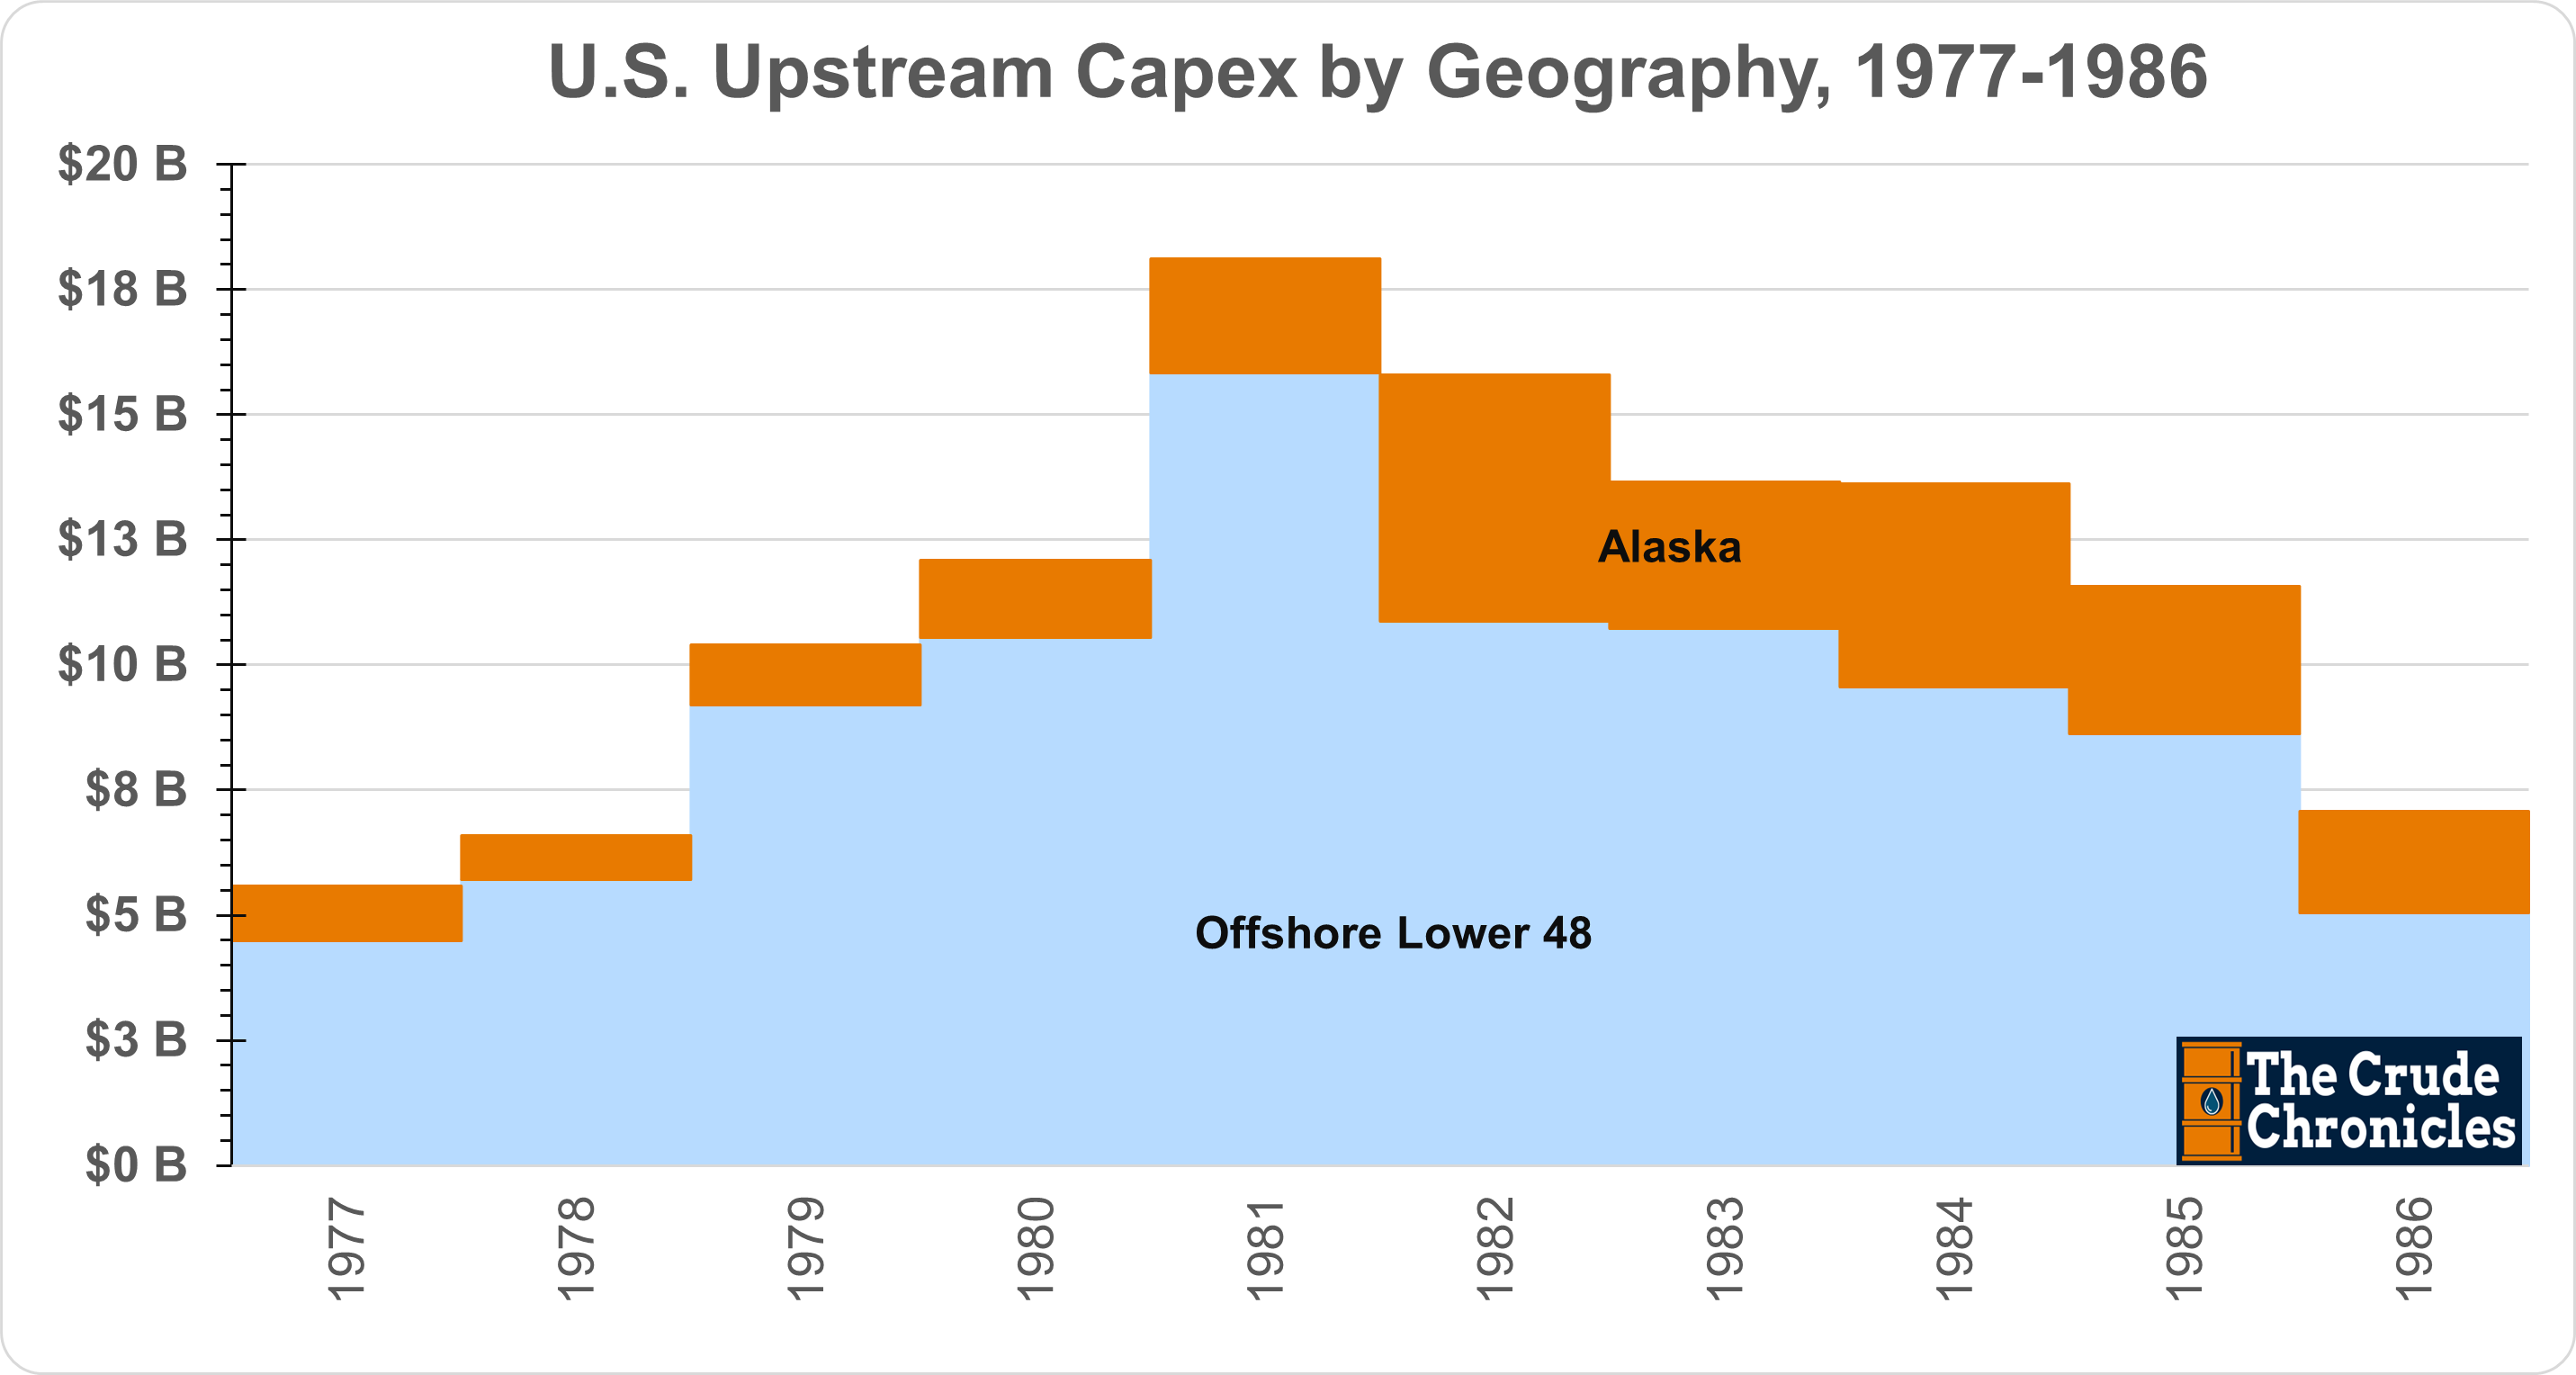
Then in 1981, the bubble burst.
Fast forward to the 2000s and these aforementioned Non-OPEC basins could no longer keep pace.
Capex intensity ($ per boe) would rise again planting the seeds for offshore to make another comeback.
People often forget that between those two super-cycles of the 1970s and 2000s, there was a mid-1990s cycle (see NOPAT ROCE chart above) that was aided by a recovery in natural gas & GoM jack-up rates.
You can see this from the chart below for some of the legacy N. American Gas E&Ps.
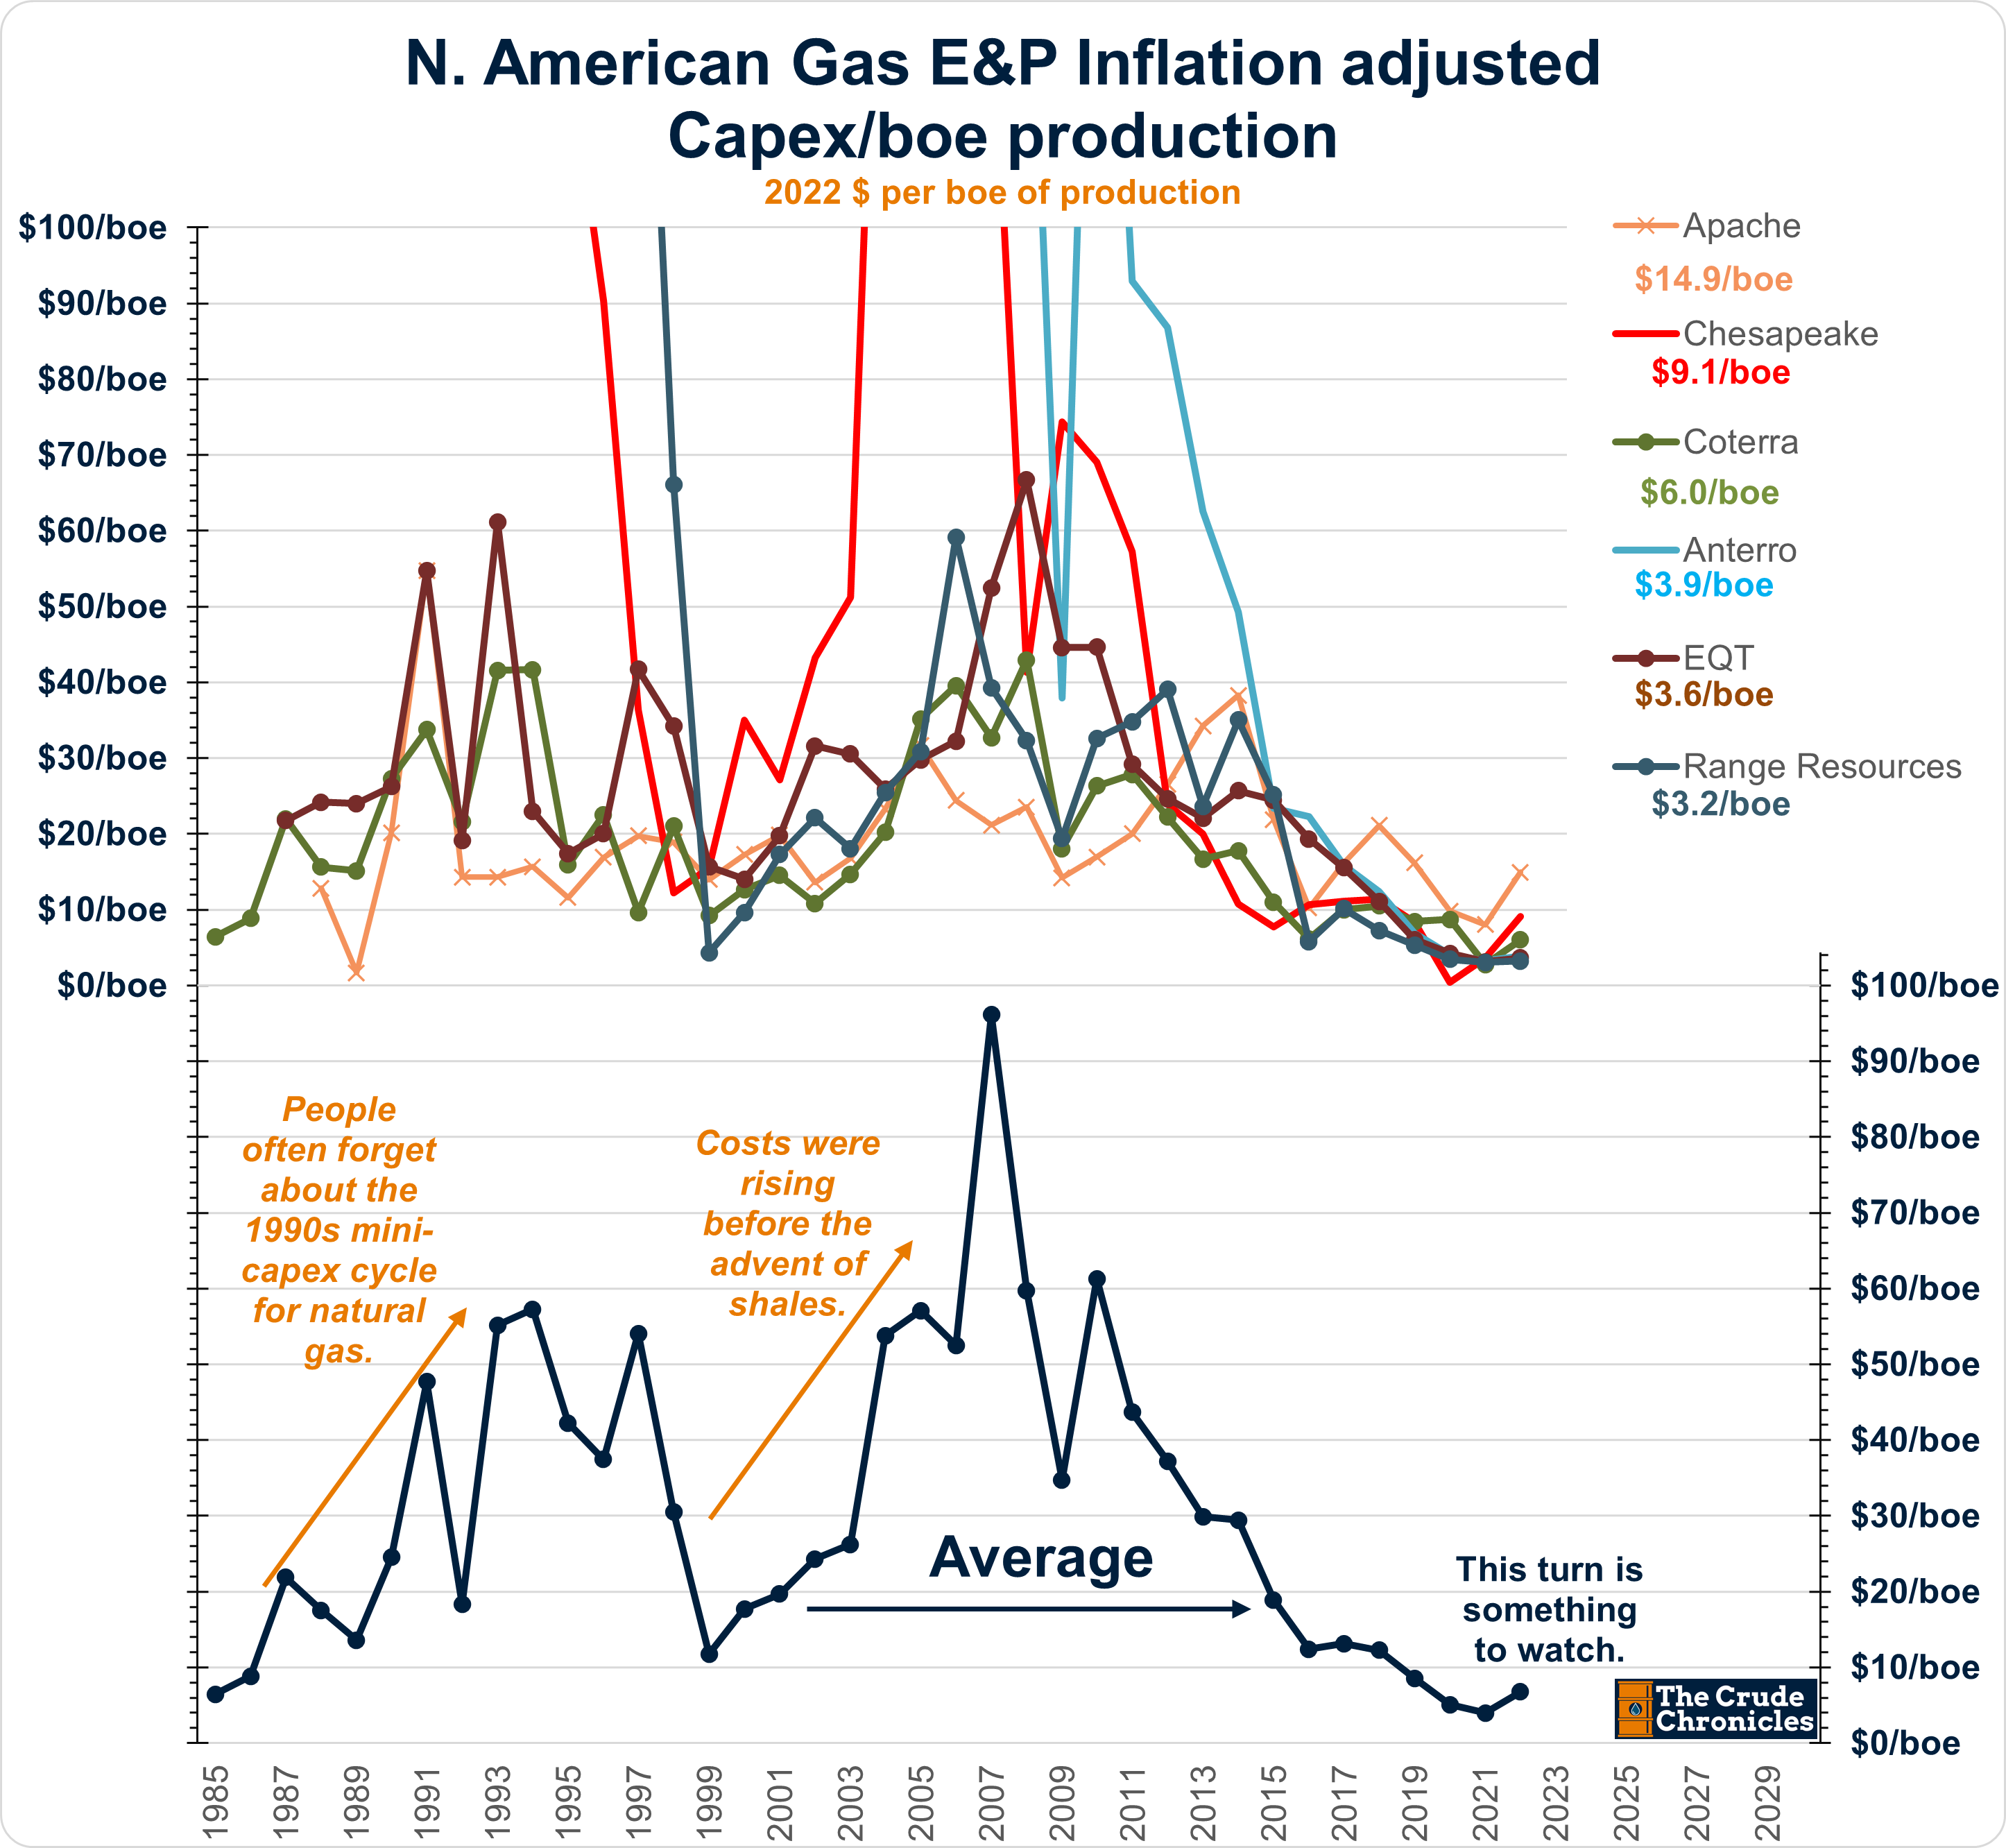
But then shales burst onto the scene.
First, they would destroy the shallow water/jack-up market - which by then was a natural gas basin.
Next, shales moved to oil and would destroy returns in the rest of the offshore industry.
The point of all this is that capex costs need to rise to create a pricing umbrella under which operators will be willing to allocate capital to their portfolio of offshore opportunities.
For the last 7 years offshore has been un-competitive with shales but that may be changing.
It is still early in the story but a continuing rise in upstream capex/boe will justify the need to get a boat. The returns are there as pointed out in my ROCE in the Water piece (HERE)
This is where the industry is now at the end of Stage 1 and transitioning to Stage 2.
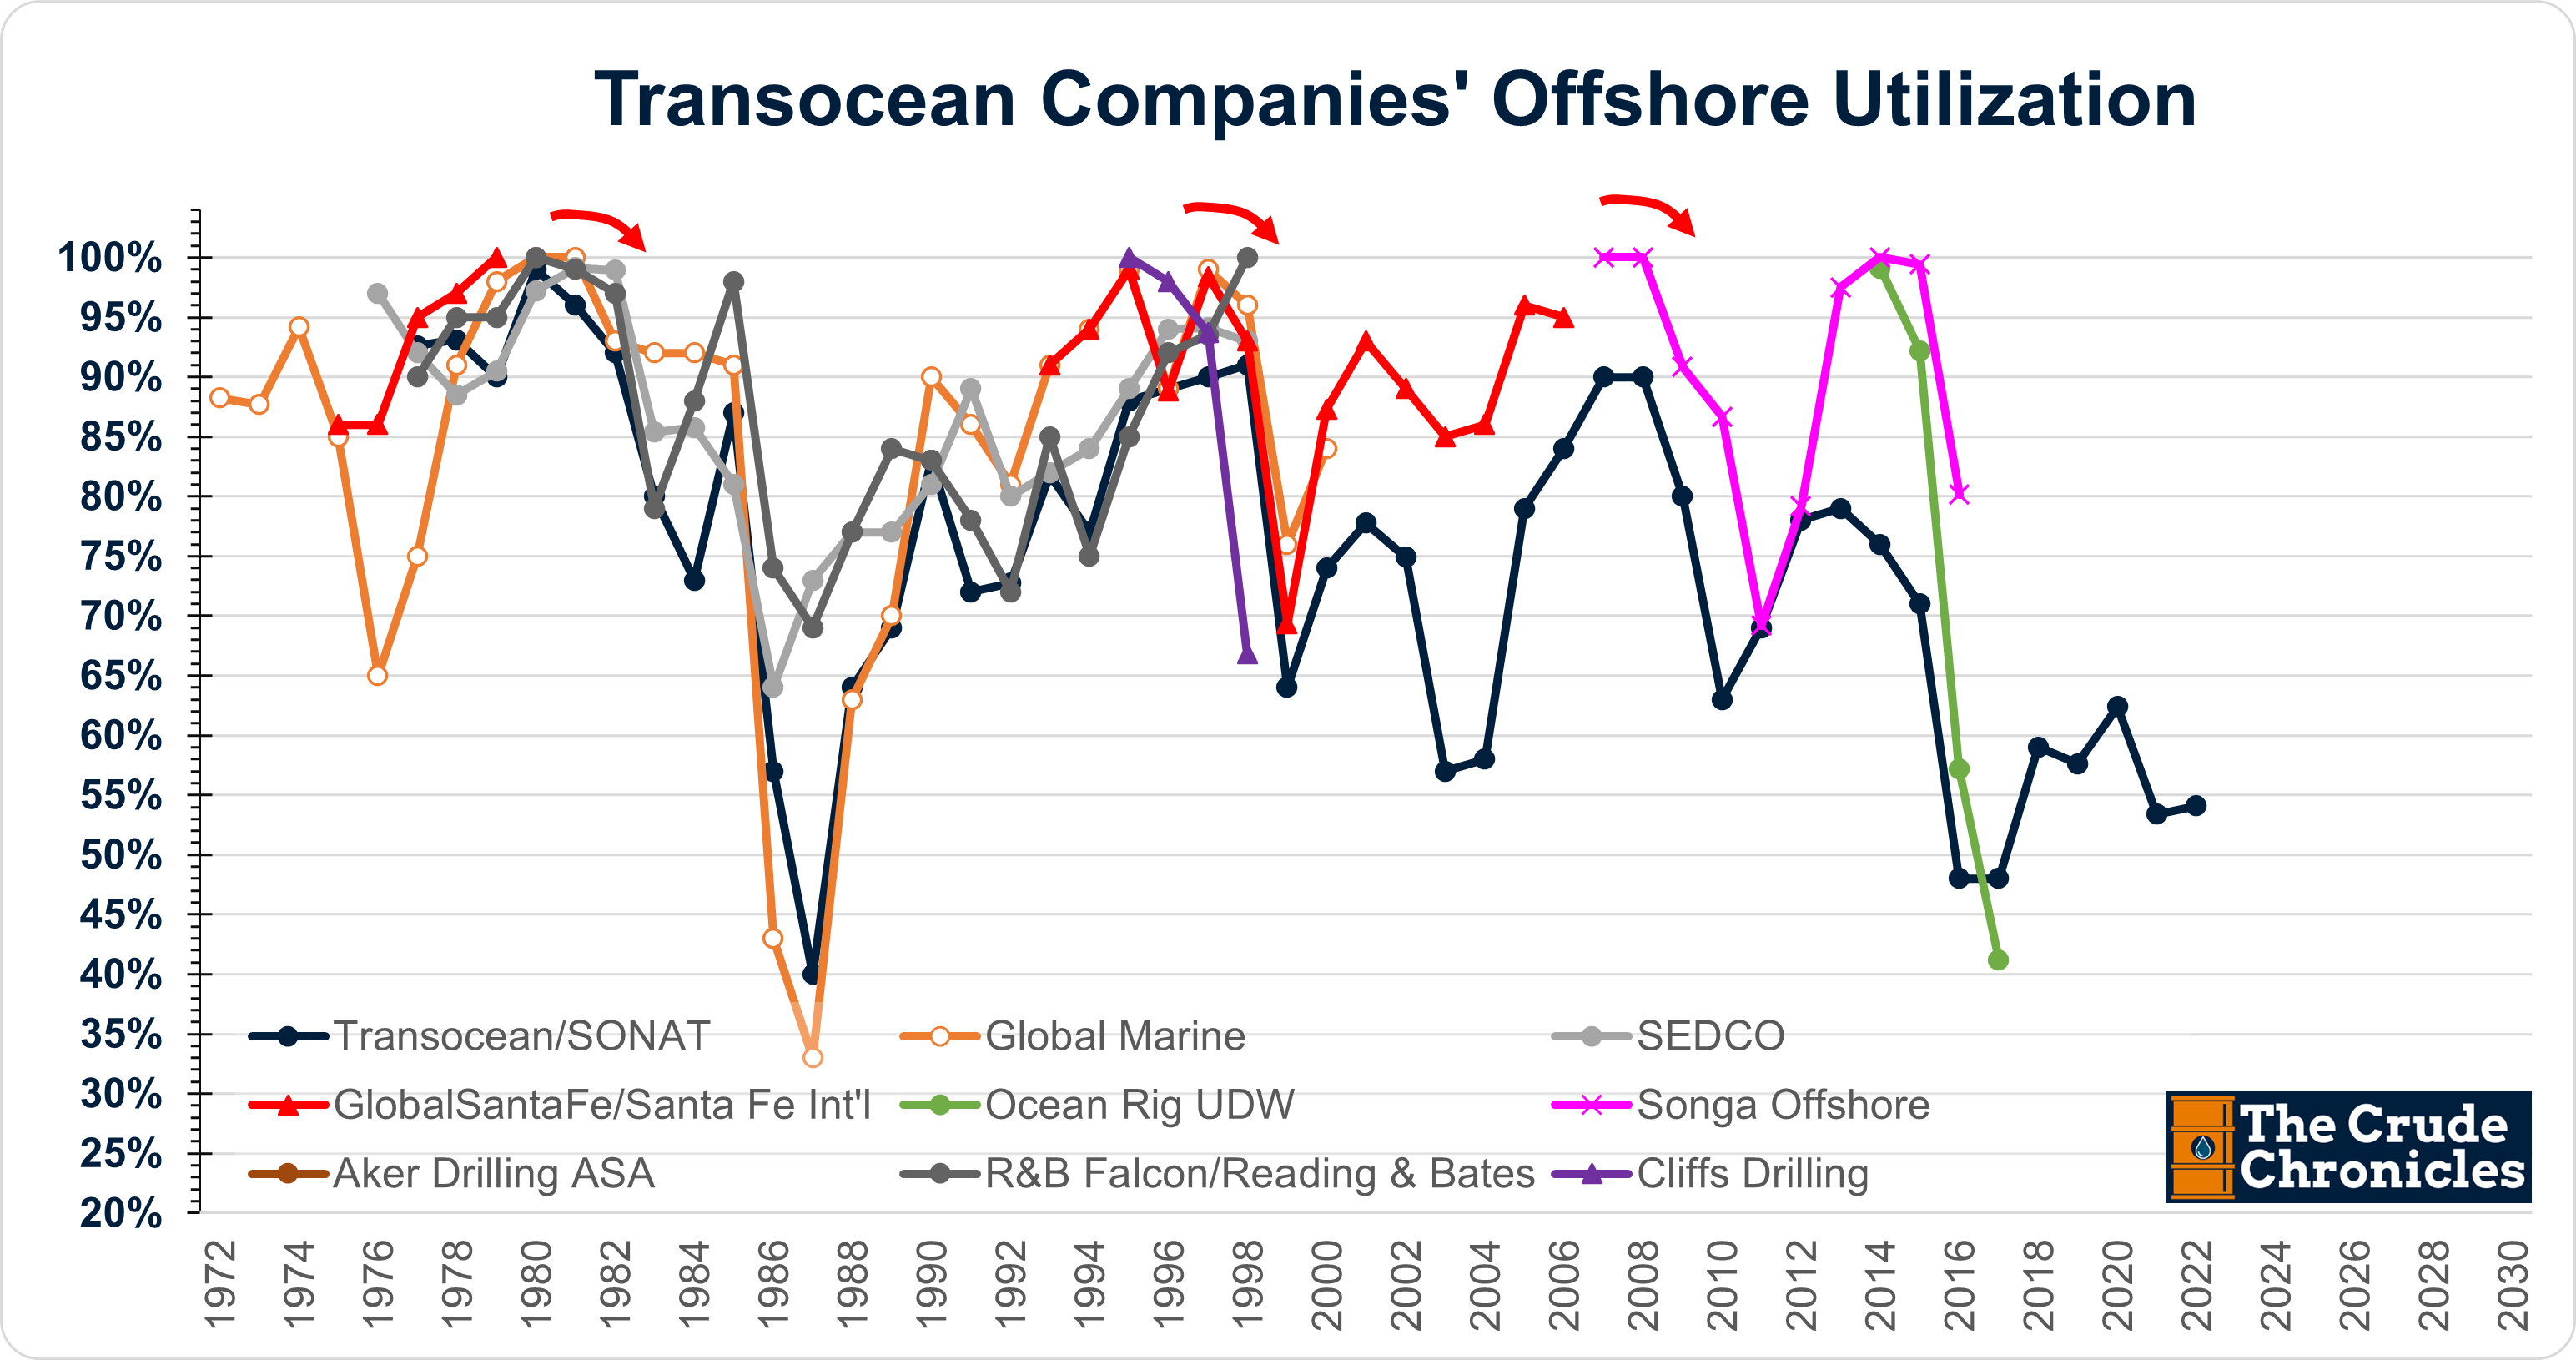
Stage 2 - The boats are put to work and utilization rates improve.
From here, utilization rates begin to improve as shown in this next chart.

As shown in the previous stage, the marginal cost of shales has declined for the last 7 years which in turn has decimated offshore utilization rates.
The only other period that was worse was the mid-1980s bust.
Both were the result of lower oil prices brought on by a Saudi-led market share war to take back share from rising non-OPEC production.
Unfortunately for the purposes of this history, the annual reports only began disclosing day rates (pricing) beginning in the early 1990s. Prior to that, they would simply provide some color.
So below is the best historical day-rate chart I could construct from the annuals.
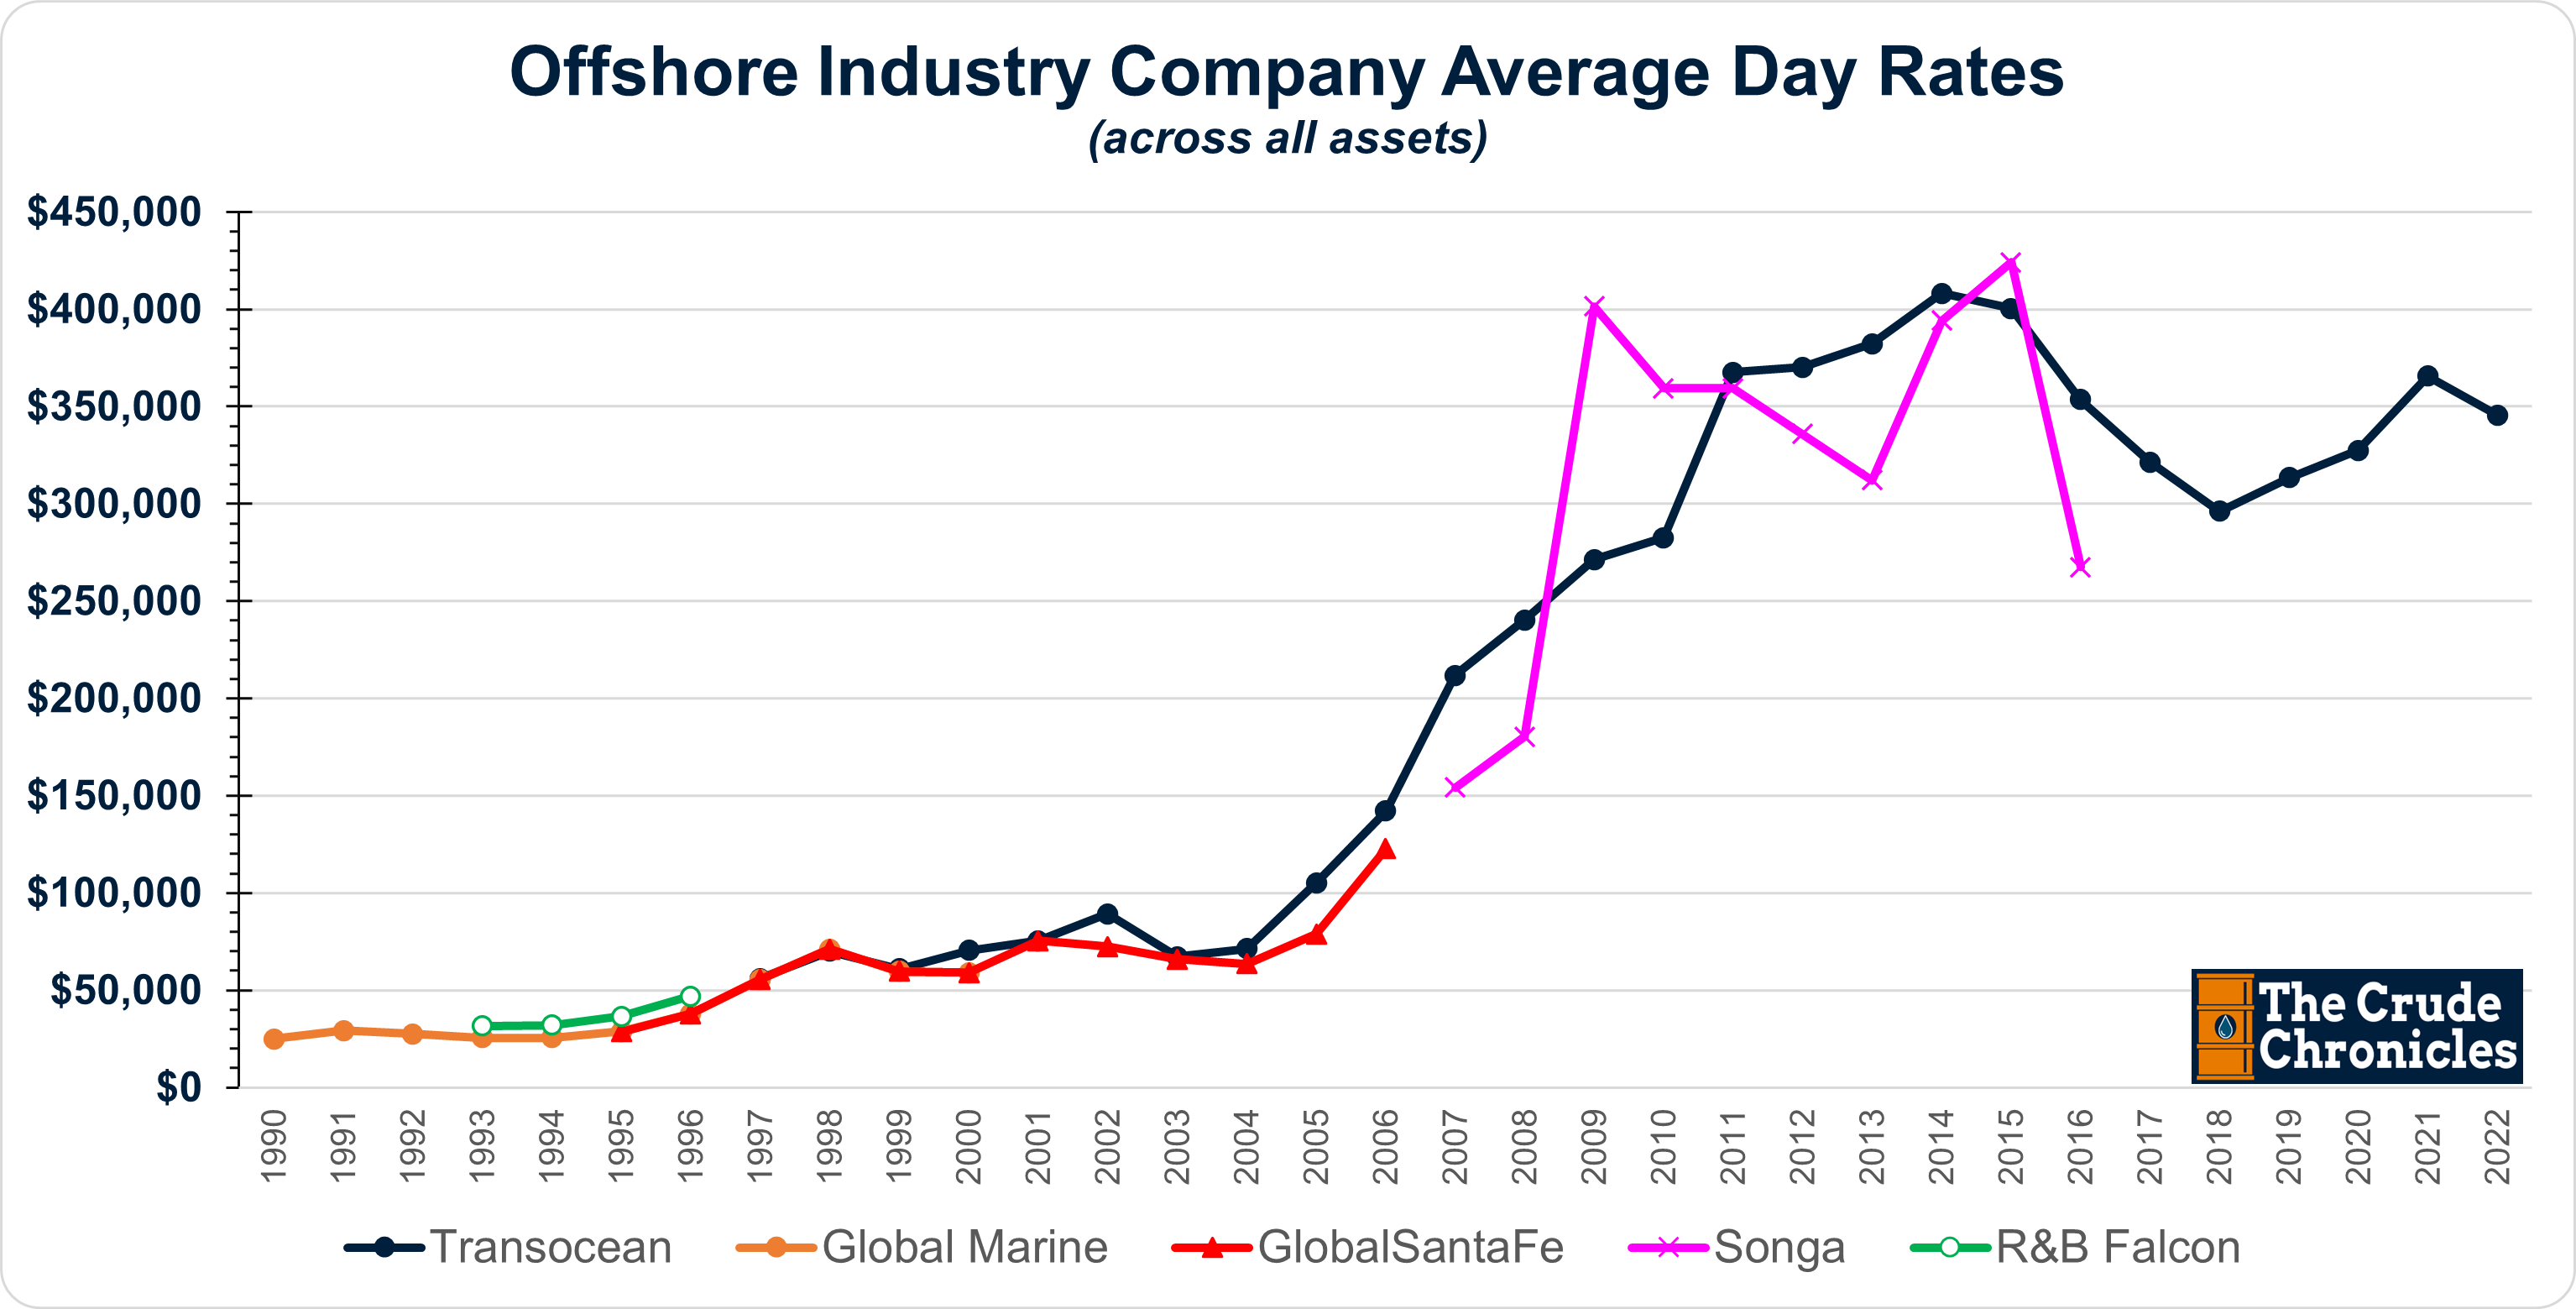
It’s not a great pictorial of pricing because the historicals reflect assets/markets RIG no longer service such as shallow water jack-ups and barges.
Stage 3 - Industry margins improve on the back of higher utilization and pricing.
Industry margins tend to improve at this point in the cycle.
This is a high-risk business and with that comes high returns as evidenced by prior cycle peak EBIT margins close to ~50%.

When this part of the cycle is in full it’s not just the highly valued assets that are earning a premium but also some of the legacy assets that come back to life.
For example
In the 1990s, day rates for some of the old shallow-water barges improved helping drive profitability.
Then in the early 2000s, although the industry was investing in ultra-deepwater assets, shallow-water jack-up rates improved.

Although Transocean has shed its shallow water assets, jack-up rates are currently being driven by the Middle East and ARAMCO spend.
Currently, Petrobras in Brazil as well as basins in Guayana, Suriname, GoM and West Africa are pulling up higher-spec floater rates.
Similar to prior cycles, demand will return for the portion of the fleet that it currently stacked - not just drillships but the older semisubmersibles as well.
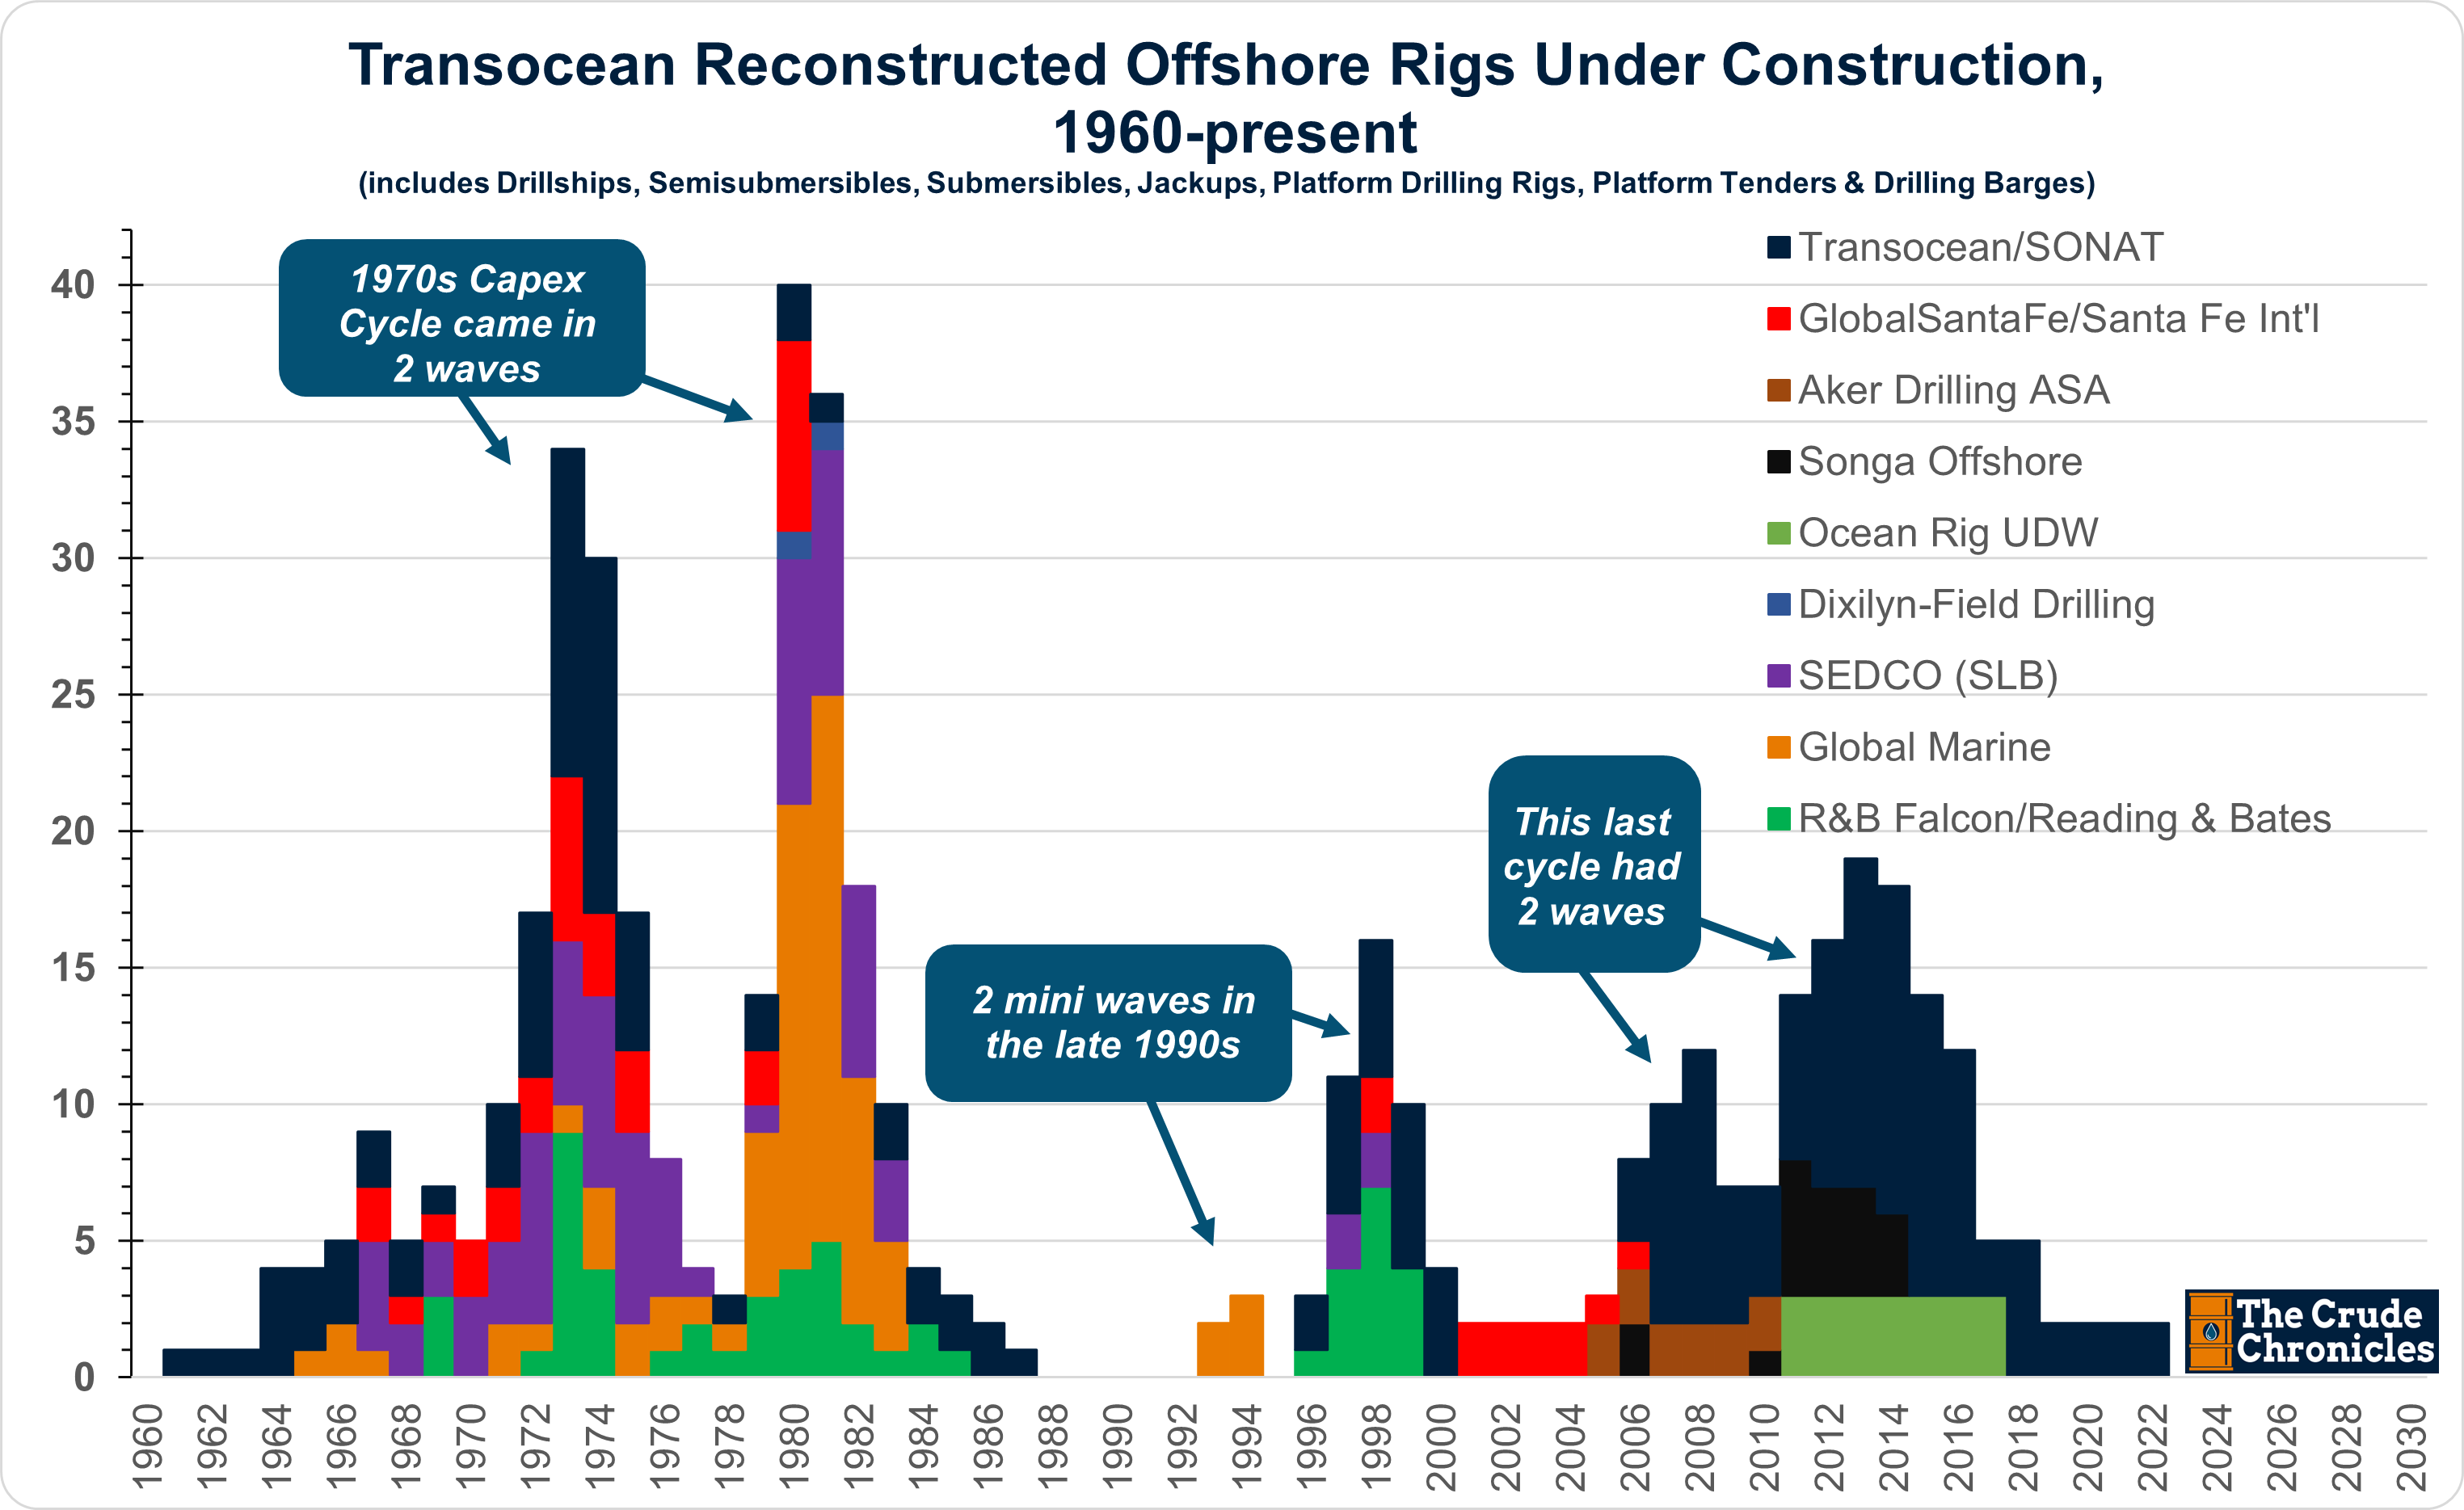
Stage 4 - The industry gorges itself on capex to replenish the fleet.
The high margin potential of offshore is paid for by the extremely high capital intensity of the business.
It is at this point in the cycle that the industry begins to replenish and construct a new fleet thus increasing capex.
Often times these capex cycles come in two waves with the second wave of boats larger than the first.
They did so in the 70s, in the 90s, in the 2000s, and will do so again. But right now it is too early to worry about that.
Transocean is currently spending less than depreciation rates but this is not a rare occurrence when looked at in the context of history.

First, they spend on refurbishments and next come the new builds with their customers helping to finance it.
If I had to guess, a replenishment rate somewhere between 20%-40% of the existing fleet signals a peak.

Yes, that’s a range wide enough to steer a drillship through but it’s my guess and I am sticking to it.
Stage 5 - Utilization & Margins Begin to Peak
At stage 5 of the cycle, a deluge of boats begins to hit the market, and utilization rolls over. This often occurs in conjunction with energy prices making their secular peak.
Which in turn causes day rates and margins to fall.

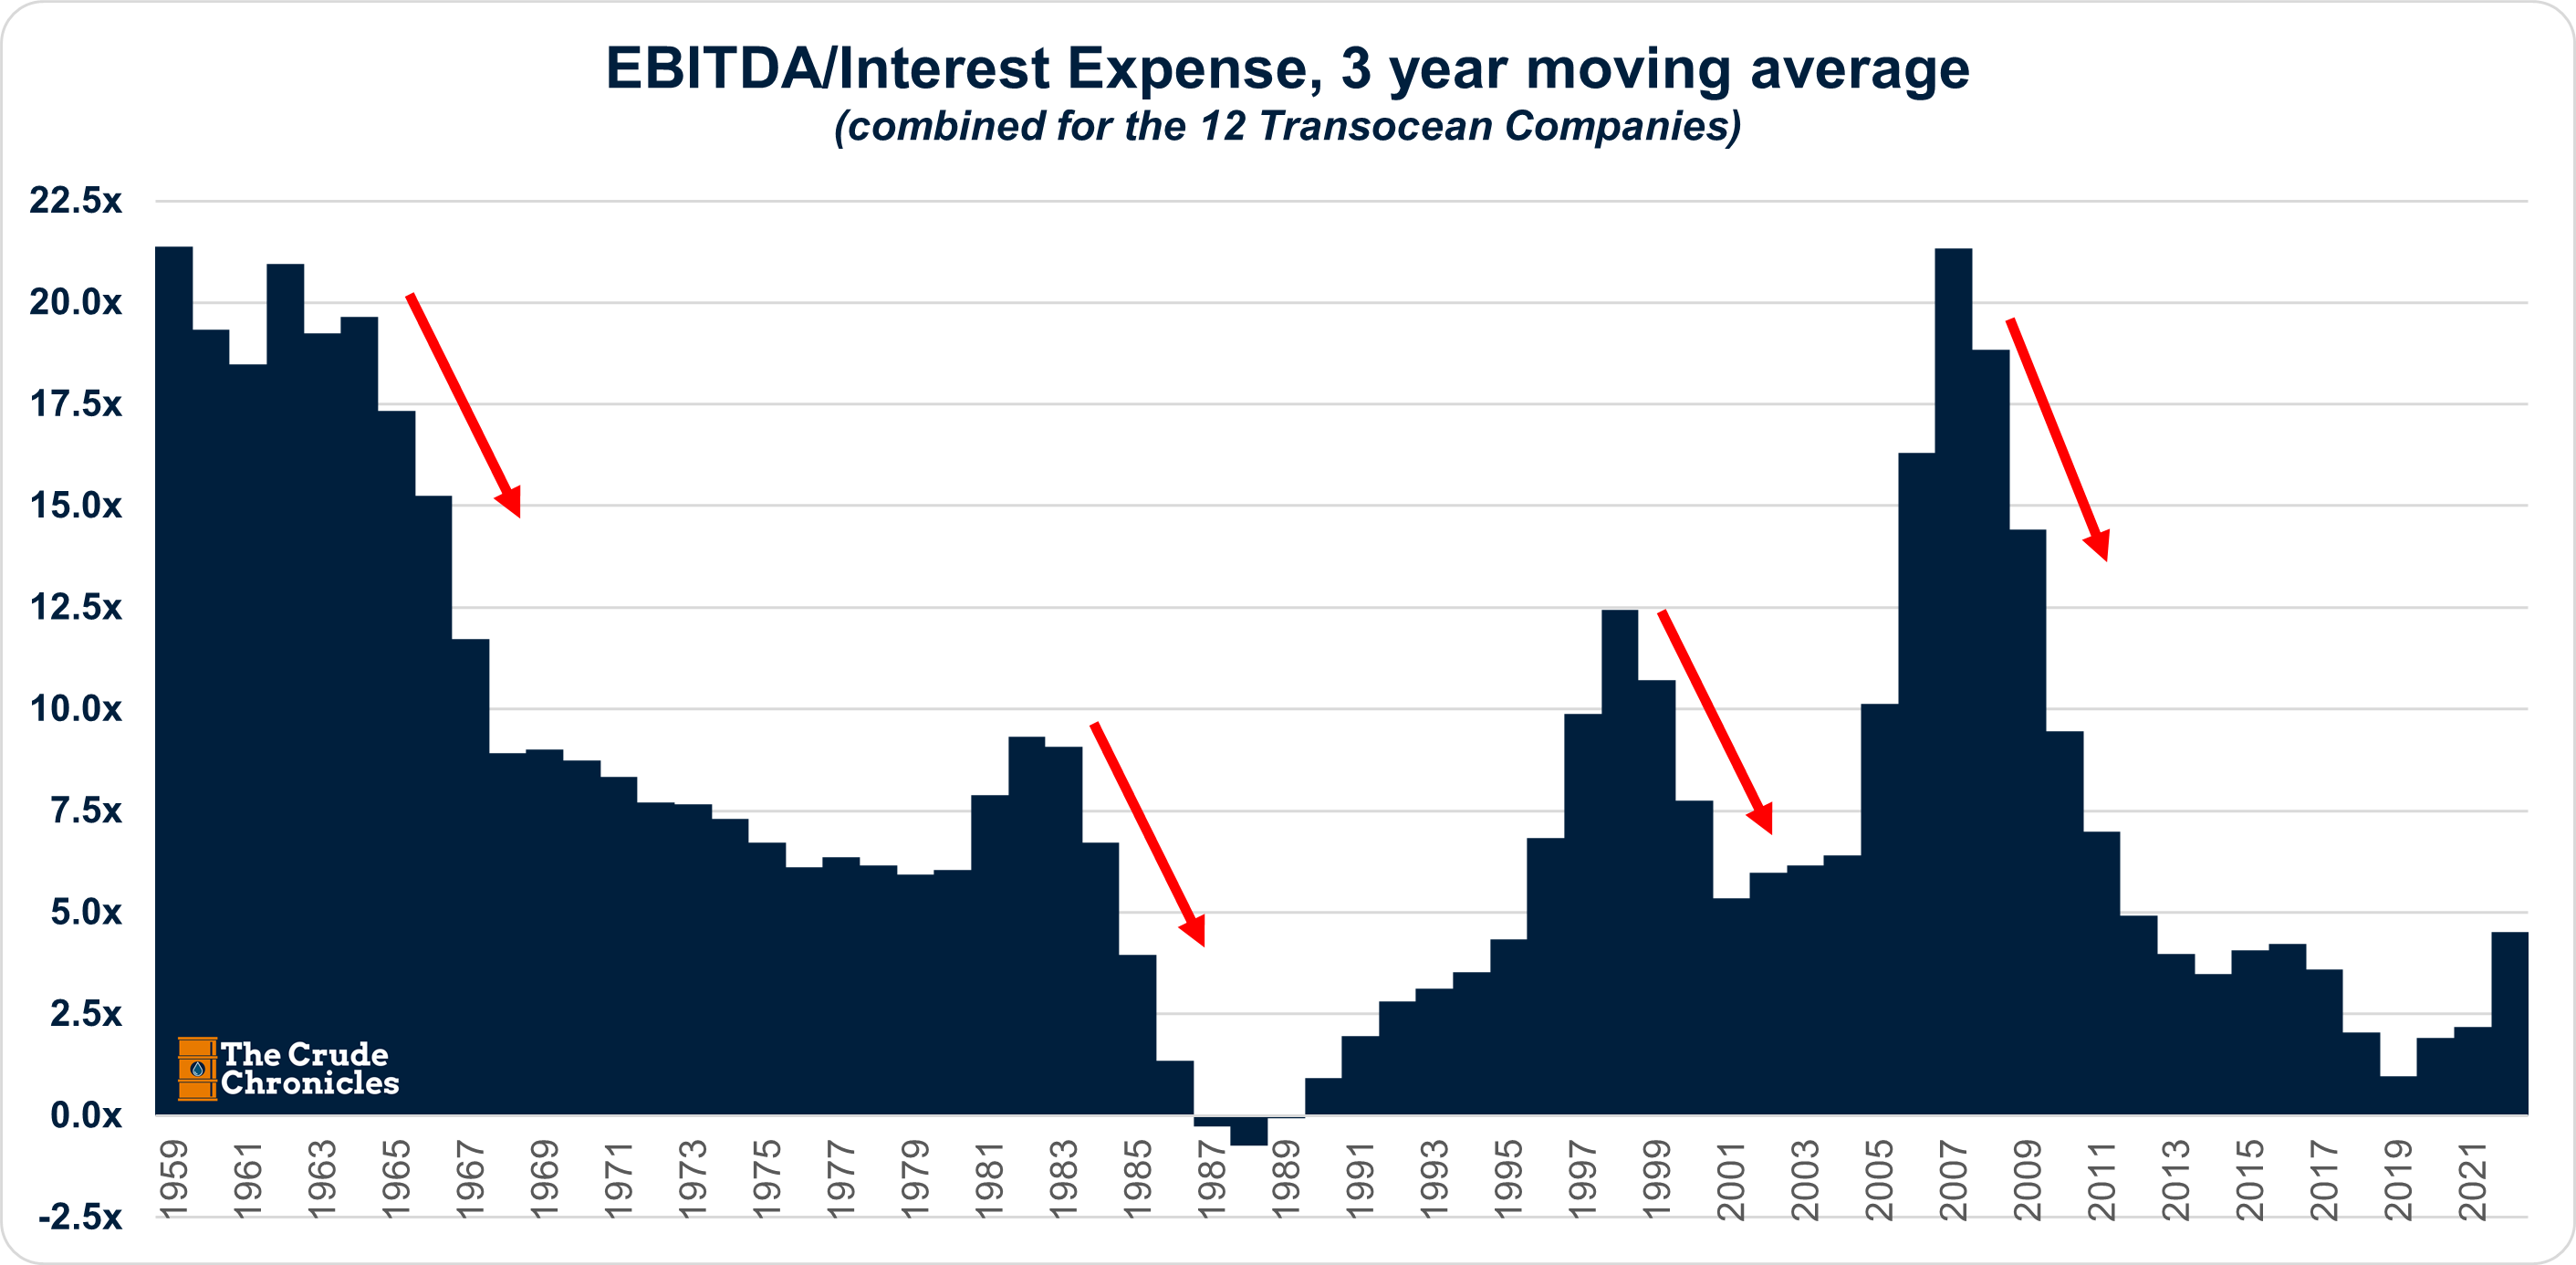
Stage 6 - An industry-wide balance sheet recession begins followed by consolidation and recapitalization.
From here the industry goes through a balance sheet recession induced by reduced profitability and the debt that was taken on to build the new fleet of boats.

Offshore drillers have trouble servicing the debt and have to go through a massive amount of restructuring, impairments, writedowns, asset sales, etc. You know, all the fun stuff.
This is the other side of the cycle that makes the same investment banking department foam at the mouth yet again.
The “multiple” irony of the offshore industry
In this industry, they all chase days rates and utilization.
Often times those come with the best and most up-to-date fleets.
The problem is that those boats cost beaucoup denaro so the drillers have to spend.
As shown below, this industry doesn’t get a multiple on margins or day rates but rather returns on capital.
This relationship between balance sheet multiples and returns on capital can be traced back through some of RIG’s predecessors as well.
But you know what they say, “Those who do not learn from history are doomed to repeat it.”
-CC
Below is the weekly chart pack in pdf form. I have a powerpoint version as well if you need it.
This blog grows with your network. Please share if you feel so inclined. And don’t forget to smash that like button!
Disclosure & Terms of Use
Nothing in this content should be considered personalized financial advice or a solicitation to buy or sell any securities.
The content provided here is for informational purposes only. You should not construe any information or other material as investment, financial, tax, or other advice. The views expressed by The Crude Chronicles LLC are solely their own. Nothing in this content constitutes a solicitation, recommendation, endorsement, or offer to buy or sell any securities or other financial instruments in any jurisdiction. Please consult your own investment or financial advisor for advice related to all investment decisions.
Terms of Use: Paying subscribers are permitted to use these charts for their own use (i.e. sharing internally or within published research to external clients) provided proper sourcing is used. Please source as "thecrudechronicles.substack.com"