Welcome back and I have something awesome to share.
This data has been a year and a half in the making!
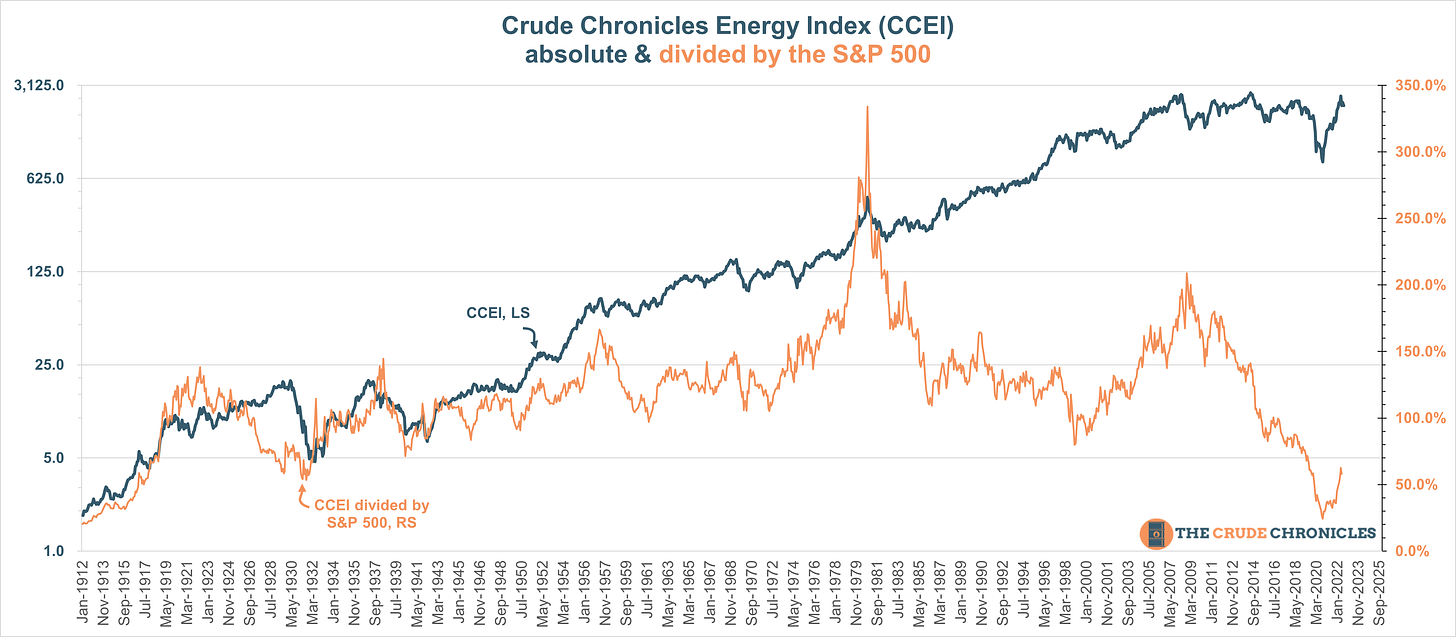
For the past 18 months I have been gathering monthly pricing data on all the major oil & gas companies throughout history to create what I call the Crude Chronicles Energy Index.
It’s been a pains taking process but you build a house brick by brick.
(Plus I’m a little crazy, but who isn’t?!)
The drawback to many energy indexes such as the S&P 500 Energy Index, the XLE 0.00%↑ , the XOP 0.00%↑ and the $OSX is they only go back to ~early 1990s.
In the past I have used the energy portfolios constructed by Fama/French (HERE) but when I reached out to them at to what companies are included I couldn’t get a good answer.
So, I built my own.
And here it is!
A couple things to note:
This is a market cap weighted index
If you want to know the components scroll all the way to the bottom of this post to get a list of the companies.
At the time of this writing it DOES NOT include OFS, refiners or drillers. I am just wrapping up my data gathering on OFS and will start to add them. SLB is almost done, HAL and BKR are next. Refiners and drillers after that. So the index will change a little.
Someone once told me perfection is the enemy of productivity so I am introducing this now.
On the subject of OFS real quick, I plan to make my own sub-index going back to the 1930s when Dresser and some other names began.
Before we jump into some charts here is the housekeeping
Last week we had over 70 respondents and 66% were bullish, 34% were bearish. Take the poll below if ya want. As I get a couple more weeks under the belt I will start dropping an updated chart on sentiment.
OK let’s begin!
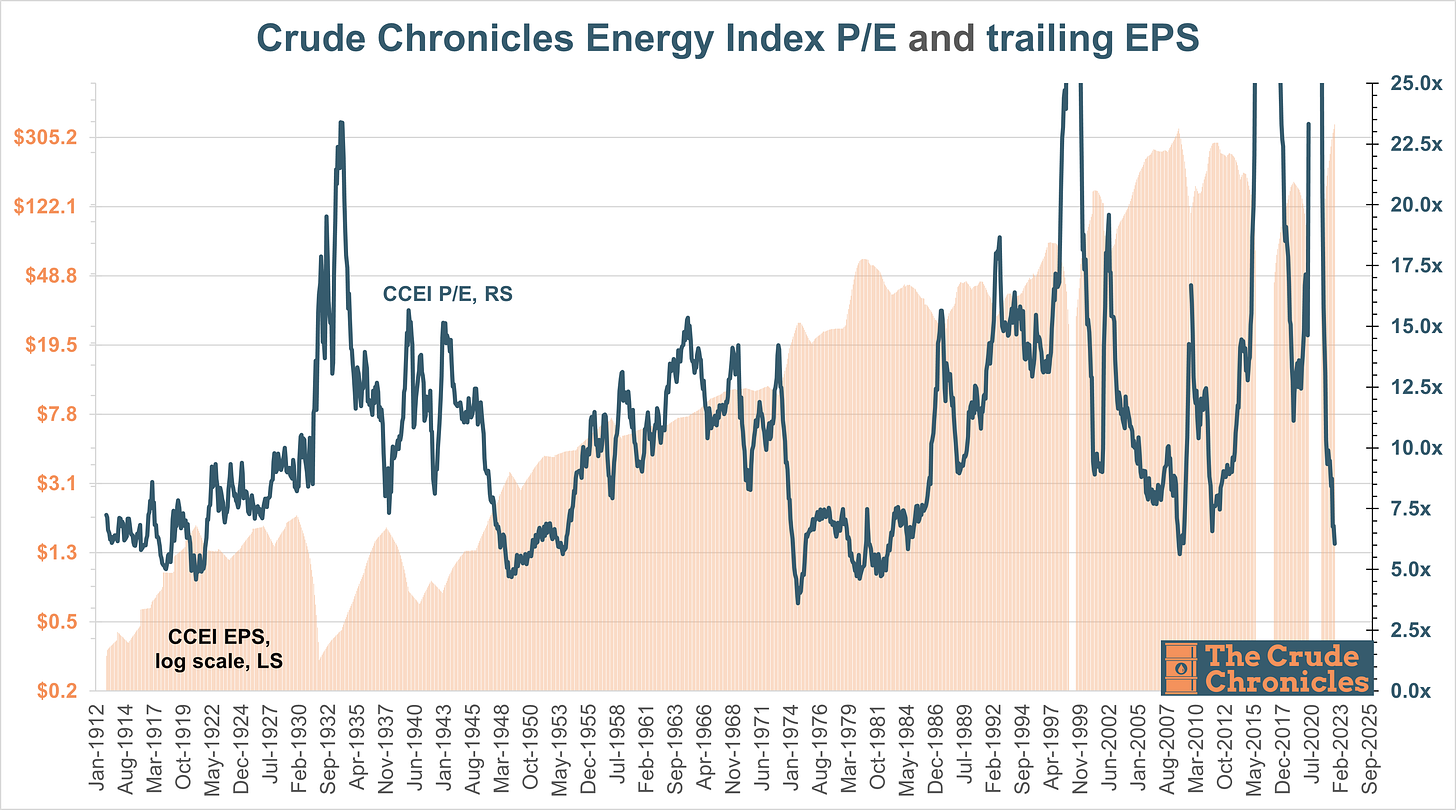
Next up is the trailing Price to Earnings Ratio for the Crude Chronicles Energy Index. And just so I don’t have to keep typing that over and over, let’s just shorten it to CCEI. Cool?!
This is an industry that goes from ~15x - 17.5x P/E at the bottom of the cycle and multiples compress to ~5.0x - 7.5x at the peak.
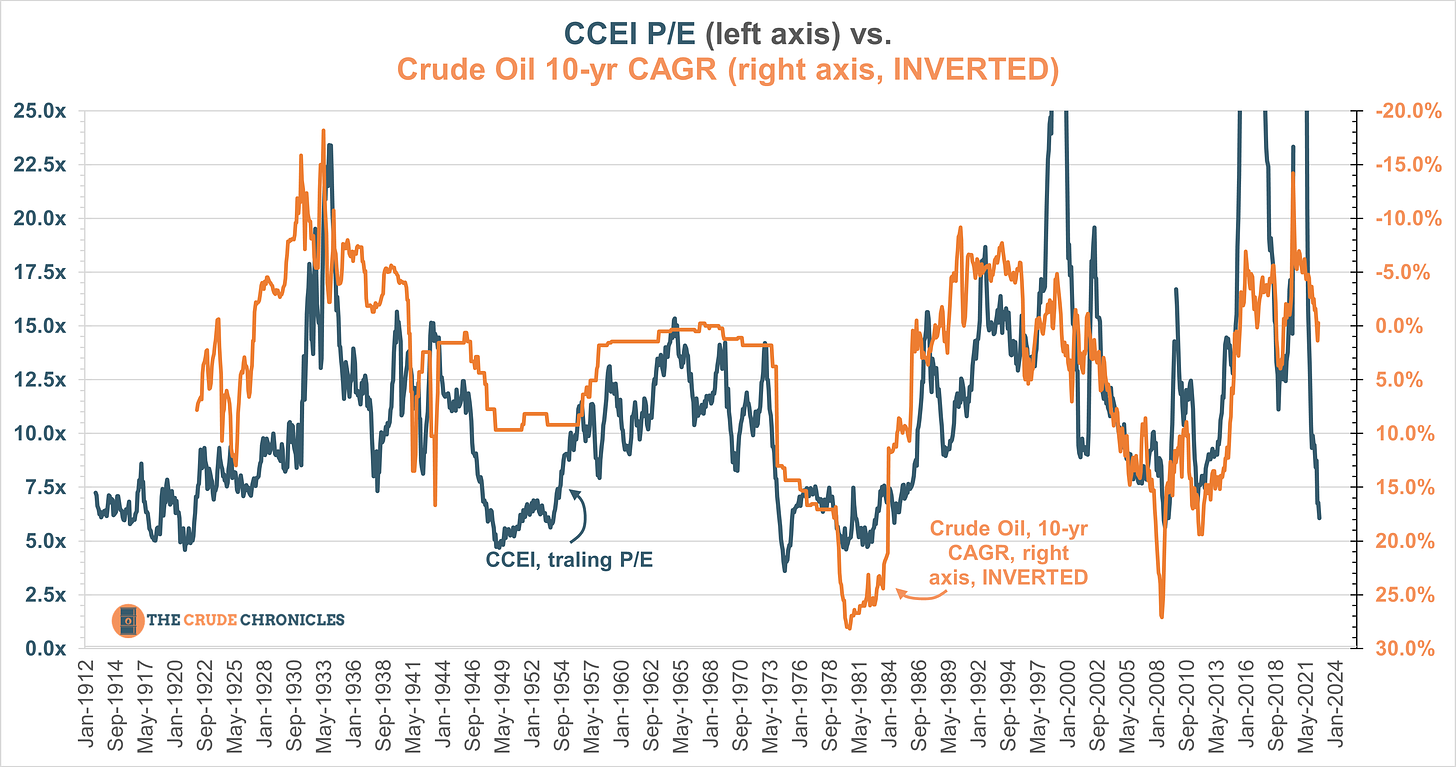
Another way to show this is the relationship in this next chart.
The blue line is the CCEI P/E and the orange line is the trailing 10 yr CAGR for Crude Oil, inverted along the right axis.
Something interesting to note is multiples have compressed very aggressively here. A bit too quickly at this point in the cycle? We shall see.
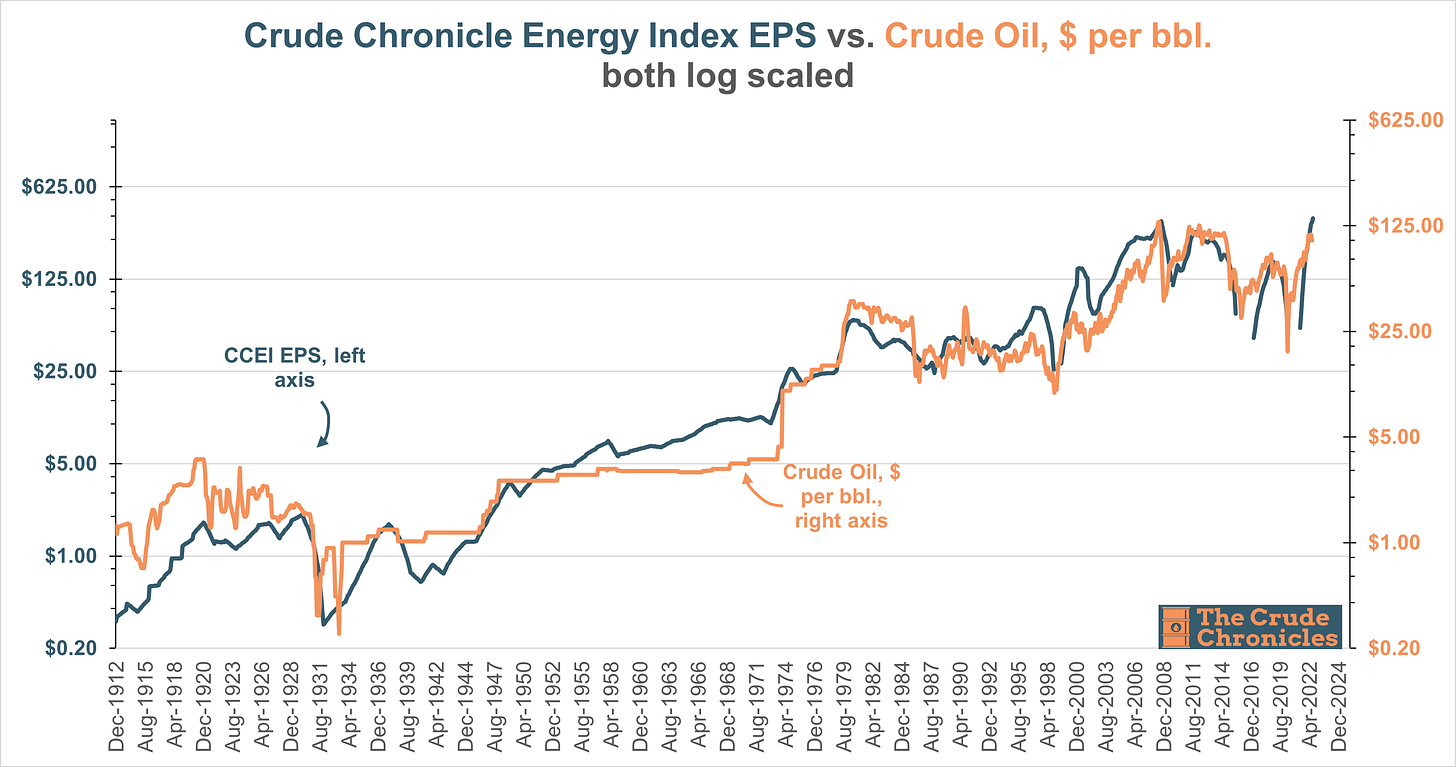
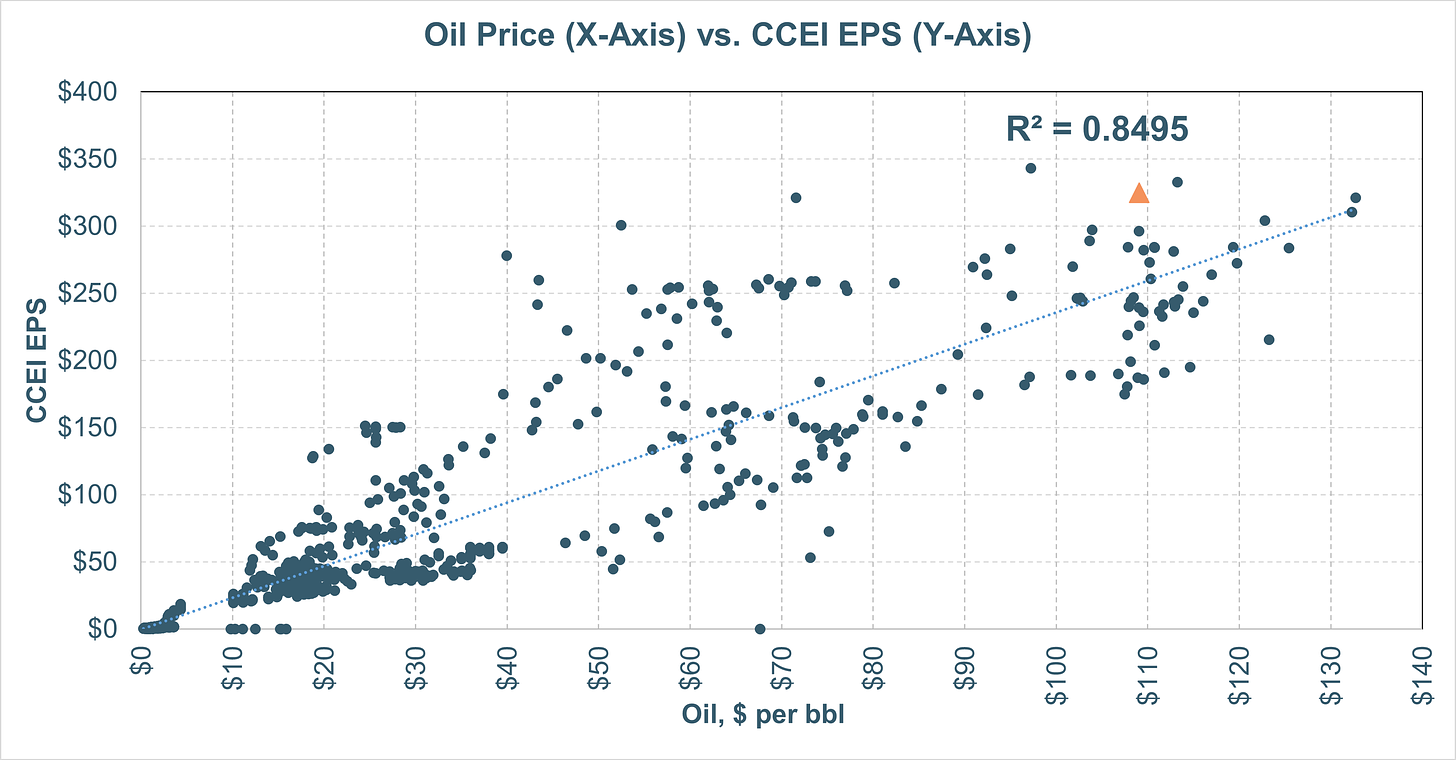
On the subject of earnings and oil prices we can see the relationship in the chart below.
Are earnings a bit ahead of where commodity prices would dictate? Hmmmm.
But there are two distinct period from the chart in my opinion. There is the pre-1973 embargo era and nationalization of the Middle East reserves and the post 1973 era.
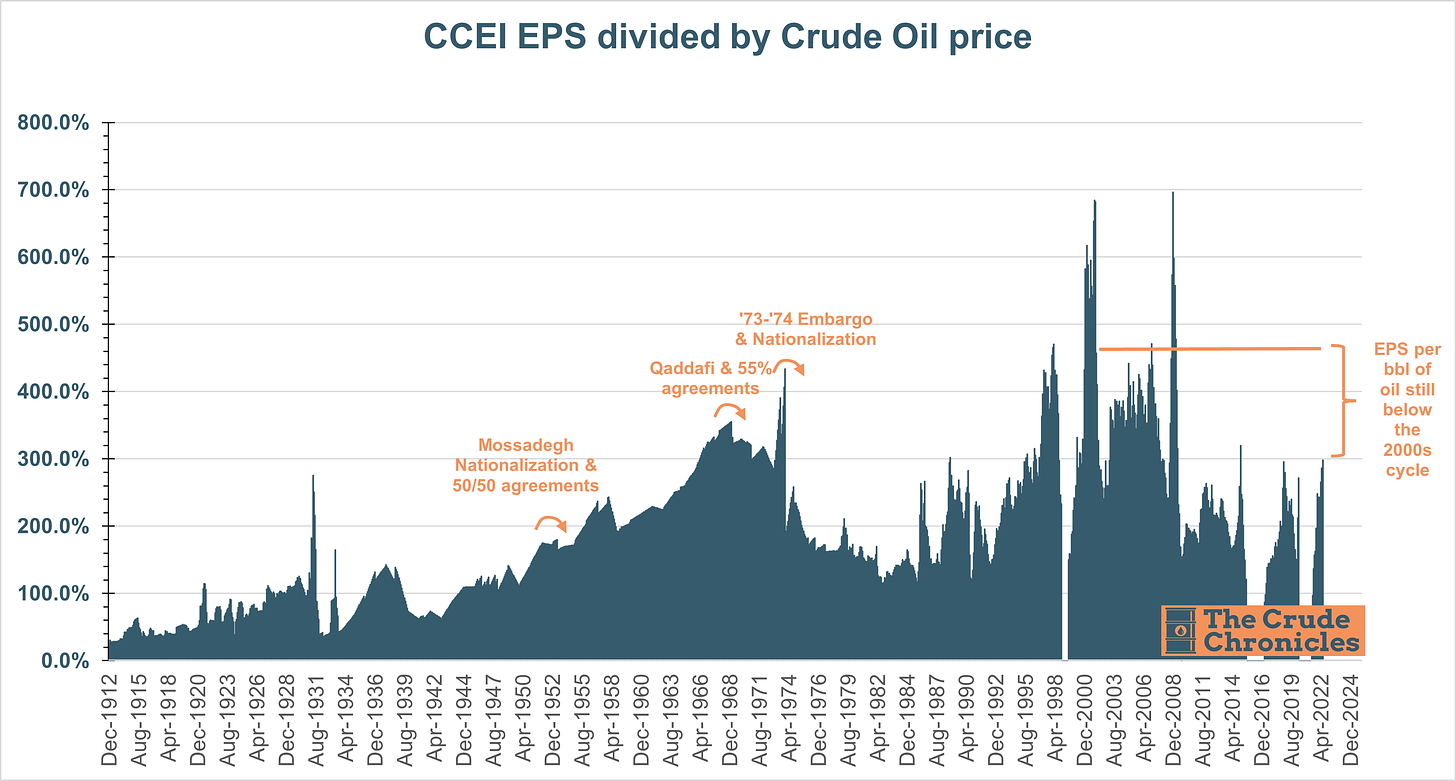
Dividing EPS by the price of oil we get this amazing chart below.
There are a couple things to unpack in this chart
First there are the effects of nationalization. First was Mossadegh nationalizing the Iranian oil industry and capturing more of the economic rents in the 1950s. This forced the oil companies to renegotiate their concession agreements to an equal split of the profits or 50/50 agreements.
Then came Qaddafi and the Libyan agreements where Occidental (HERE) negotiated a 55% split and the oil producers would all follow in his footsteps.
Finally came the 73/74 nationalization.
If we compare the current level to the 2000s cycle earnings potential is still half that level. Interesting!
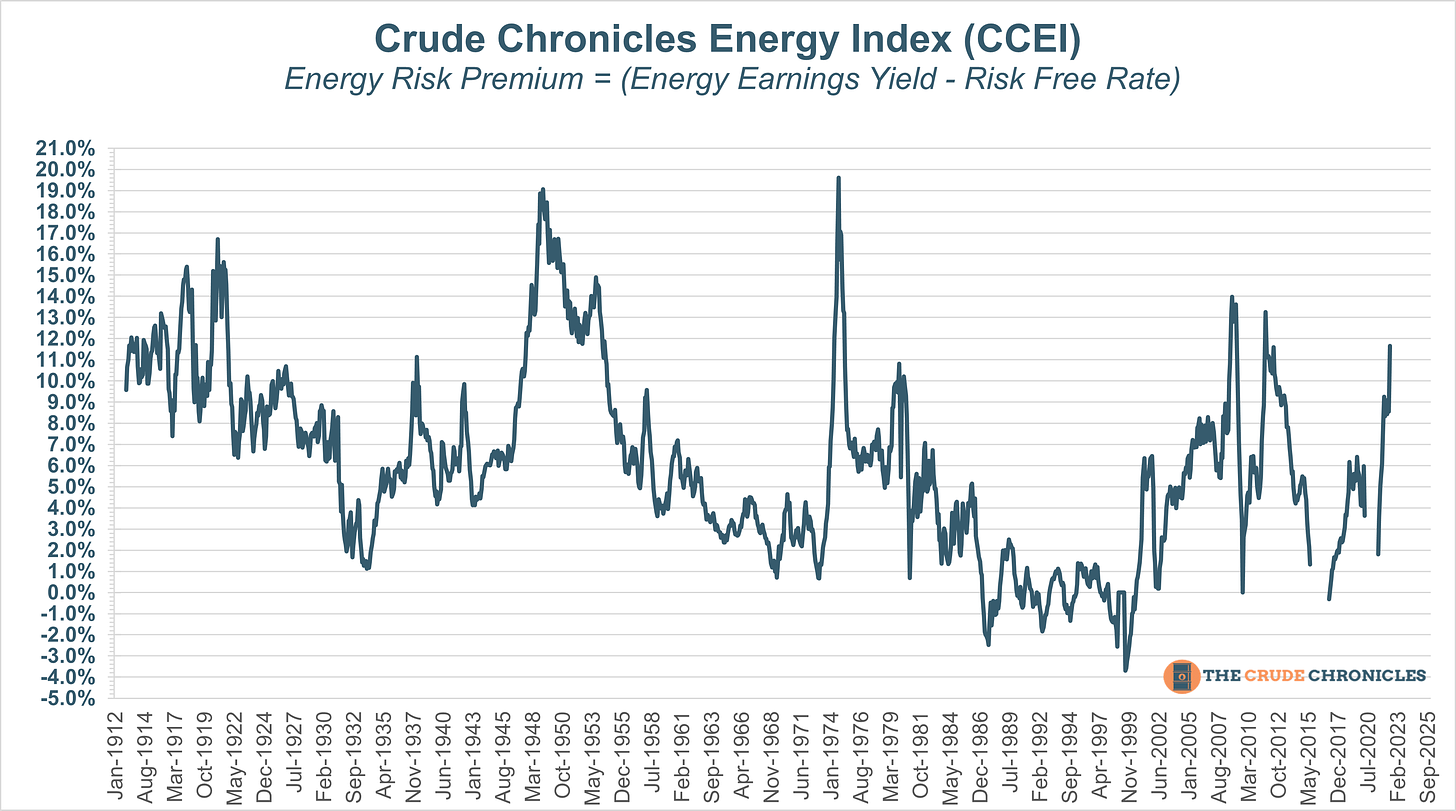
This next chart compares the earnings yield vs. the risk free rate (U.S. 10-yr treasury) or what I call the CCEI energy risk premium.
When looking at this chart we have to be cognizant of where we are in the cycle. In the beginning of a secular bull market, it screams bullish as you are being compensated for the risk.
But as shown earlier, P/E’s compress in the later stages of a cycle so earnings yield will appear high.
I think we are in the former not the latter (HERE and HERE).
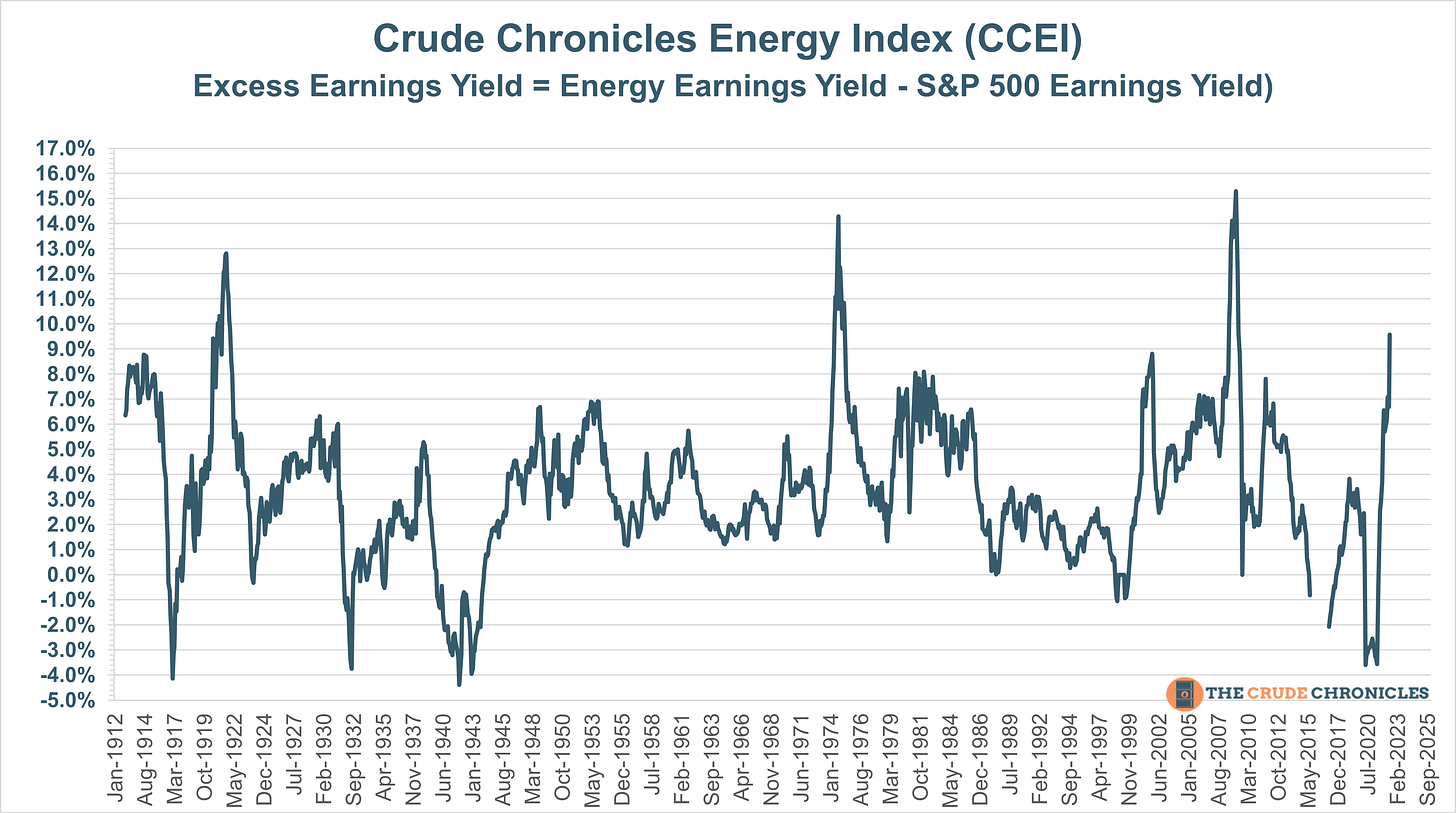
Next let’s compare the earnings yield on energy vs. the market or S&P 500.
Investors are getting ~9% more earnings yield from energy vs. the market, one of the highest in history.
I hope you enjoyed this piece.
See you next week.
But before ya go, let me ask you for a favor.
If you loved the content, please share
If you like the content, please subscribe
If you have some thoughts/opinions, leave a comment
Or option D, do none of the above and just stay tuned!
Disclaimer
I certify that these are my personal views at the time of this writing. I am not paid or compensated for any of my content. And above all else, this IS NOT an investment newsletter and there is no explicit or implicit financial advice provided here. My views can and will change in the future as warranted by updated analyses and developments. As you may have noticed, I make comments for entertainment purposes as well.
The Crude Chronicler
The Crude Chronicles Energy Index includes the following companies
ExxonMobil companies include- Standard NJ/Exxon/ExxonMobil 1912-present, Standard NY/Socony-Vacuum 1912-1999, Vacuum Oil Co 1912-1931, XTO 1993-2010
Chevron companies include: Standard of CA/Chevron 1912-present, Noble Energy 1972-2020, Atlas Energy 2004-2010, UNOCAL 1924-2005, Pure Oil 1920-1965, The Texas Company/Texaco 1912-2001, Getty Oil 1928-1984, Tide Water Associates 1922-1966, Skelly Oil 1919-1968, Gulf Oil 1922-1984, Standard Oil of KY 1912-1960
BP companies include: Anglo-Persia/Anglo-Iran/BP 1923-present, Atlantic Refining/ARCO 1929-2000, Richfield Oil 1937-1965, Sinclair Oil 1916-1969, Standard Oil of IN/AMOCO 1912-1998, Standard Oil of OH/SOHIO 1912-1986, Standard Oil of Nebraska 1912-1938, Standard Oil of Kansas 1912-1947, Pan American Petroleum & Transportation 1918-1935
Royal Dutch Shell Group Companies include: Royal Dutch Shell Group 2001-present, Royal Dutch Petroleum 1915-2001, Shell Transport & Trading 1915-2001, Shell Union Oil 1922-1985
ConocoPhillips Companies include: COP/Phillips Petroleum 1919-present, Conoco/Continental Oil 1917-1980, Concho Resources 2007-2020, Burlington Resources 1988-2006, Marland Oil 1921-1927
Occidental Companies include: Occidental 1957-present, Anadarko 1986-2019, Kerr-McGee 1956-2006, Union Pacific Resource Group 1995-2000, Oryx Energy 1988-1997, Vintage Petroleum 1990-2005 and Cities Services 1940-1983
Apache Energy/APA Corp 1973-present
Anterro Energy 2013-present
Chesapeake Energy 2021-present. I know, need to gather the pre bankruptcy data
Continental Resources 2007-present
Coterra 1990-present
Devon Energy 1985-present
EOG Resources 1989-present
EQT 1984-present
Diamondback 2012-present
Pioneer Resources 1987-present
Range Resource 1980-present
As of this writing, the following companies will be added in the future
Remaining XOM Companies of Superior Oil, Humble Oil, Magnolia Petroleum
Pennzoil
BG Group
Total Companies of Total/CFP, PetroFina & Elf Acquitaine
E&Ps to be added are APA/Apache, Marathon Oil, Hess, Amerada Petroleum
I will be adding the Oilfield Service Companies such as Schlumberger, , Cameron/Cameron Iron Tool Works, Smith International & Camco, Halliburton, Landmark Graphics, Gearhart, Dresser Industries, Baker Hughes, Baker Oil Tools, Hughes Tool Co, BJ Services, Nowsco, Reed Tool Co, Western Co of N. America
Other Industries to add include Oilfield Equipment and Refiners.


Small feedback, but the answers ‘yes’ and ‘nope’ don’t really align with asking are you bullish or bearish.
You could make the poll responses ‘bullish’ and ‘bearish’ to make it more intuitive.
CC is the chart master! Always creative and educational uses of charts.