The Gist: (1) The O&G community does not widely follow CAT despite the observation that volumes in its Energy and Transportation segment lead U.S. oil & gas production growth. (2) CAT gets late-cycle pricing power around the peak in production growth. It is recently coming off of a pricing cycle. (3) Sales to O&G end users have been strong due to the post-pandemic catch-up but expect them to normalize from here.
The first chart below shows that volume growth within CAT's Energy and Transportation (E&T) segment leads U.S. oil and gas production growth rates.
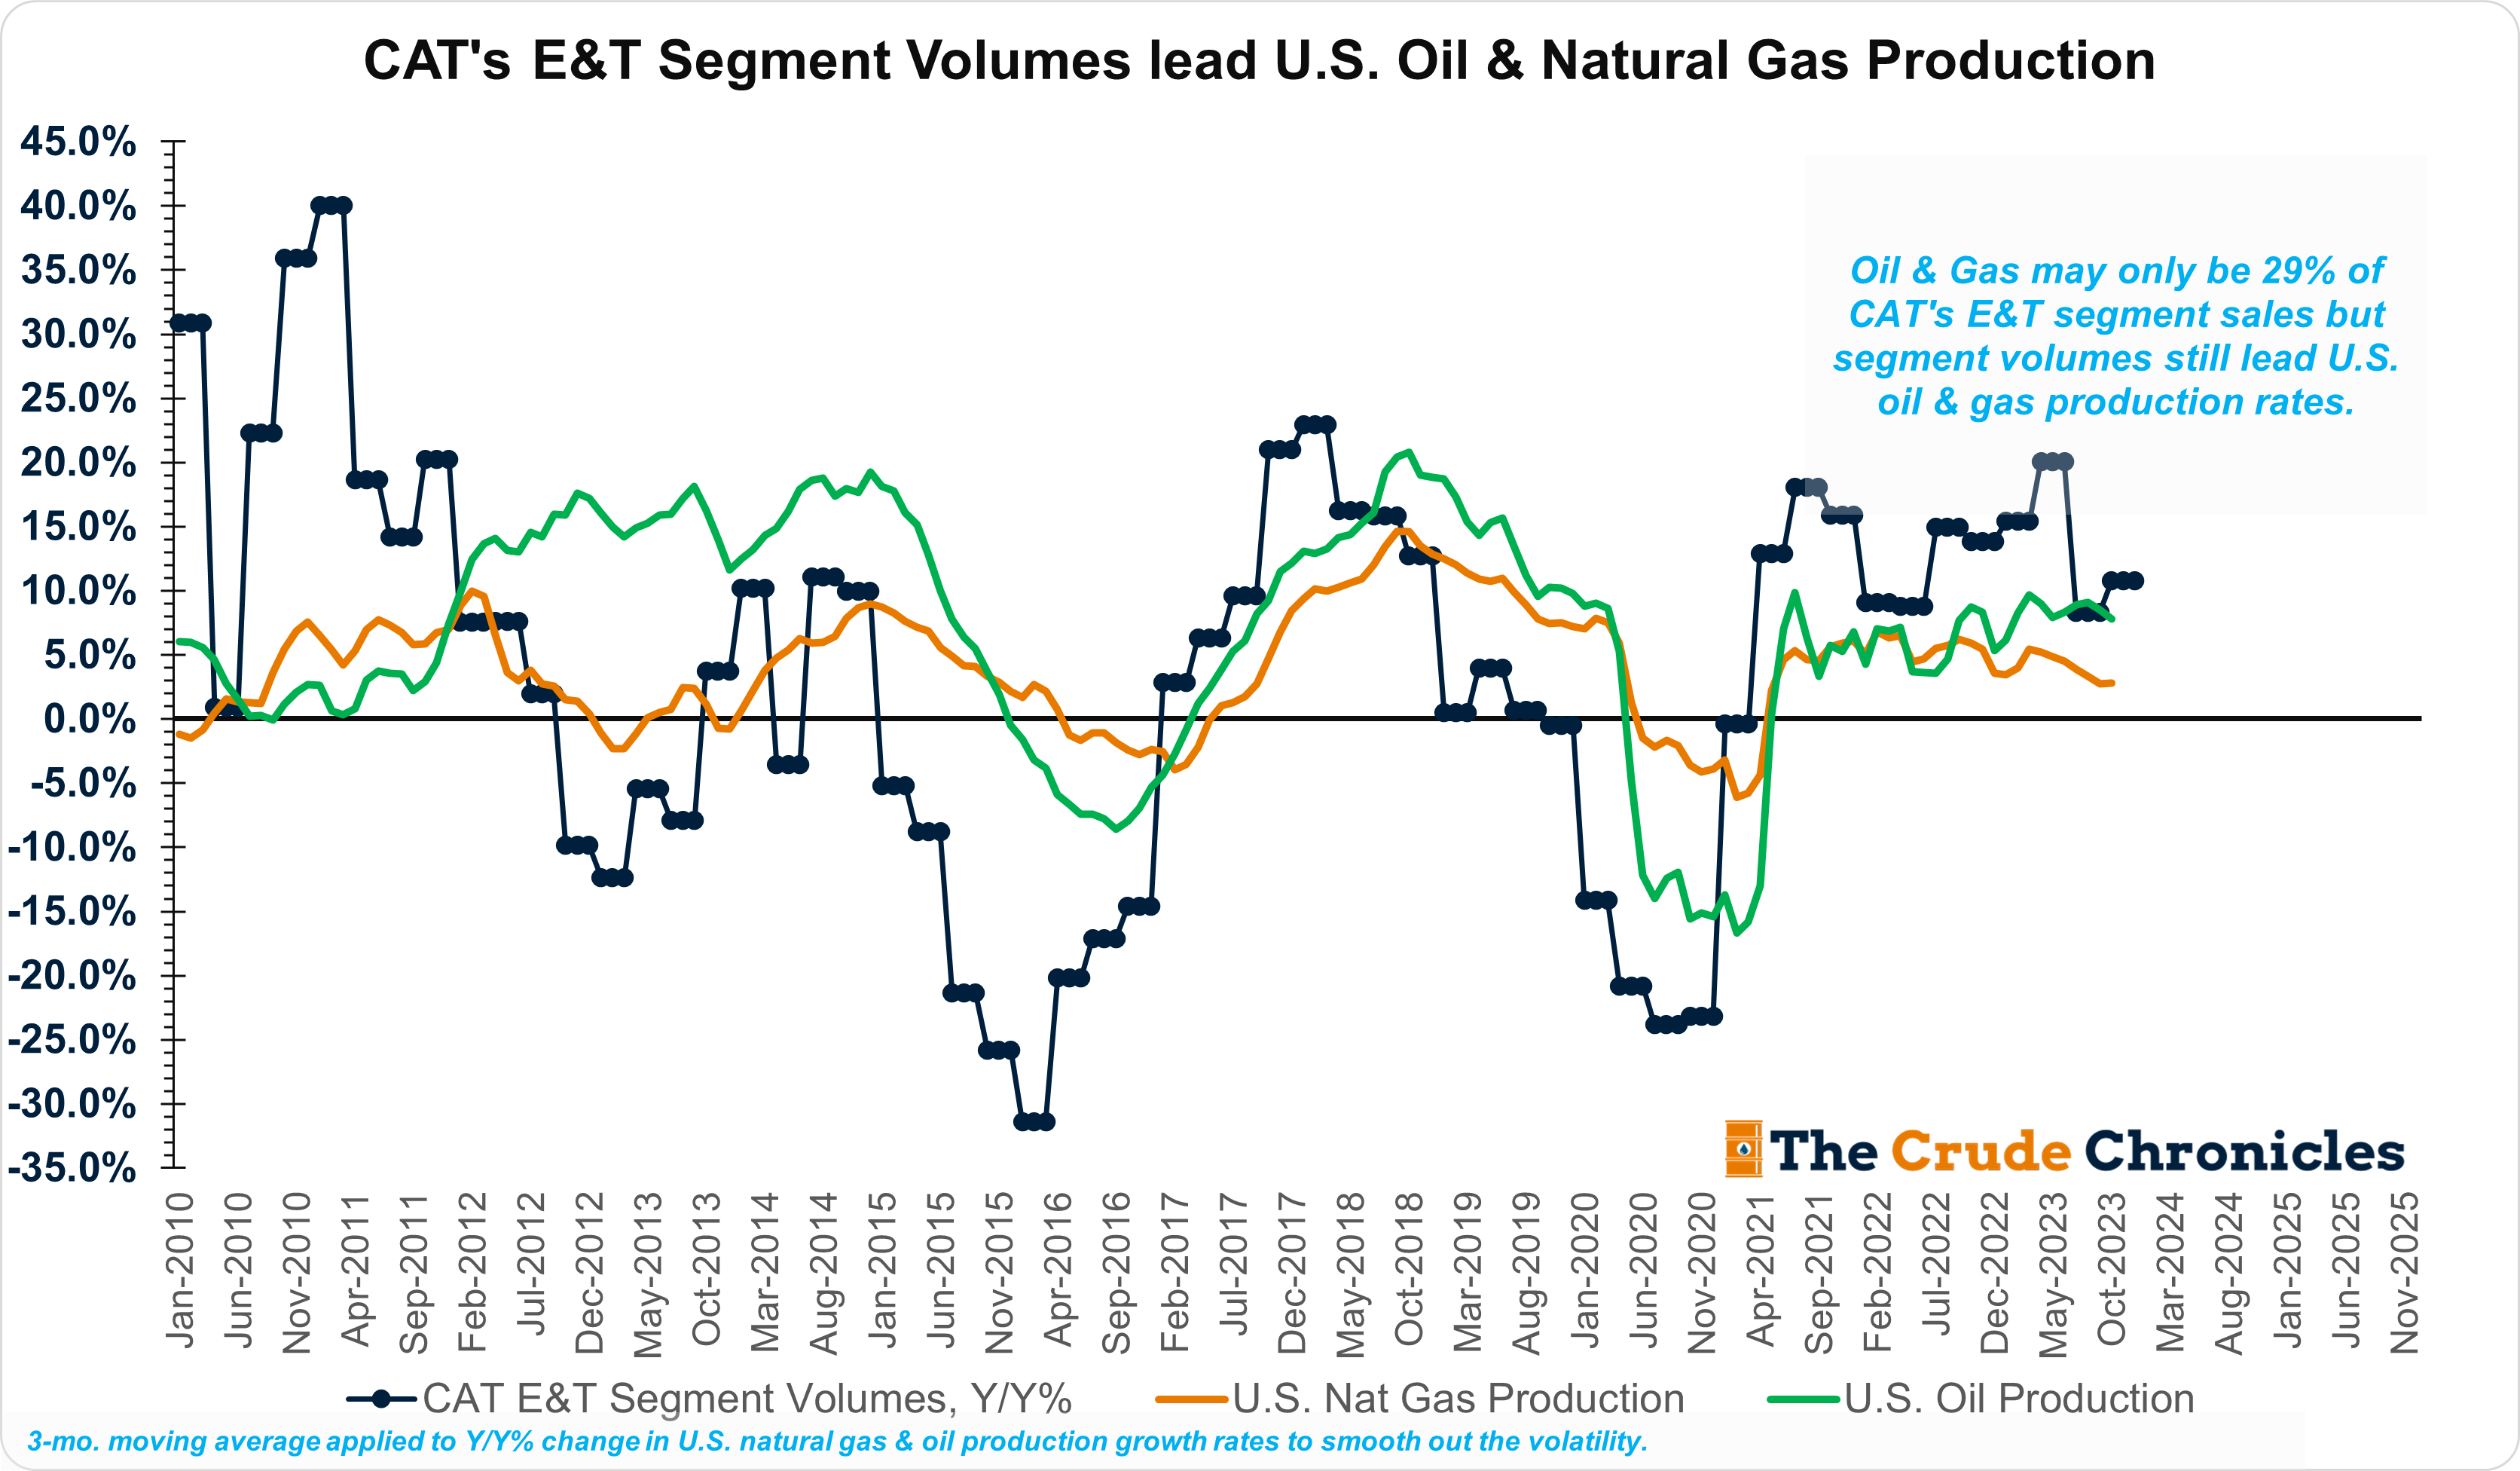
There are a couple of reasons for this relationship:
CAT provides a wide variety of products, after-market parts, and services to a wide array of customers in the oil & gas end markets (HERE). They provide engines and power needs to both onshore and offshore drilling rigs. Their turbine business sells to midstream natural gas customers. They sell into the well completion and servicing end markets. Recently they acquired Weir Oil & Gas which provides services for the pressure pumpers.
CAT is more than just an OEM; the aforementioned O&G end users, in contrast to traditional construction machinery, generate a higher mix of aftermarket parts and services. Parts and service is early cycle and picks up before later cycle OE.
O&G only represents about 29% of E&T segment volumes. The other 71% are industrial, power generation, and transportation end markets. Nonetheless, when volumes are picking up there as well, typically the economy is gaining steam, oil & gas demand picks up and commodity producers respond with more production. So the relationship holds.
Finally, CAT runs a dealer network so when this line is accelerating, they're pushing volumes to dealers, and in turn, dealers sell to retail, which are the end users of CAT’s products and services.
I'm watching E&T volumes through the balance of 2024 to see if that blue dotted line continues to decelerate which would portend U.S. production growth slowing as well.
The second chart below shows that CAT tends to get late-cycle pricing power around the peak in production.
Listen to this episode with a 7-day free trial
Subscribe to The Crude Chronicles to listen to this post and get 7 days of free access to the full post archives.