

Zooming in on The Most Important Oil Chart in 2025 - Below the Paywall

Most Mondays, I feature a few charts from a post that was behind the paywall to provide you with (1) a look at my historical research process & product in order to (2) hopefully entice you to try out the paid subscription service by hitting the button below. (3) If you’re not quite ready to subscribe then this post is here for your enjoyment.
The following charts is an excerpt from my January 3rd, 2025 post titled The Most Important Oil Chart in 2025 (HERE).
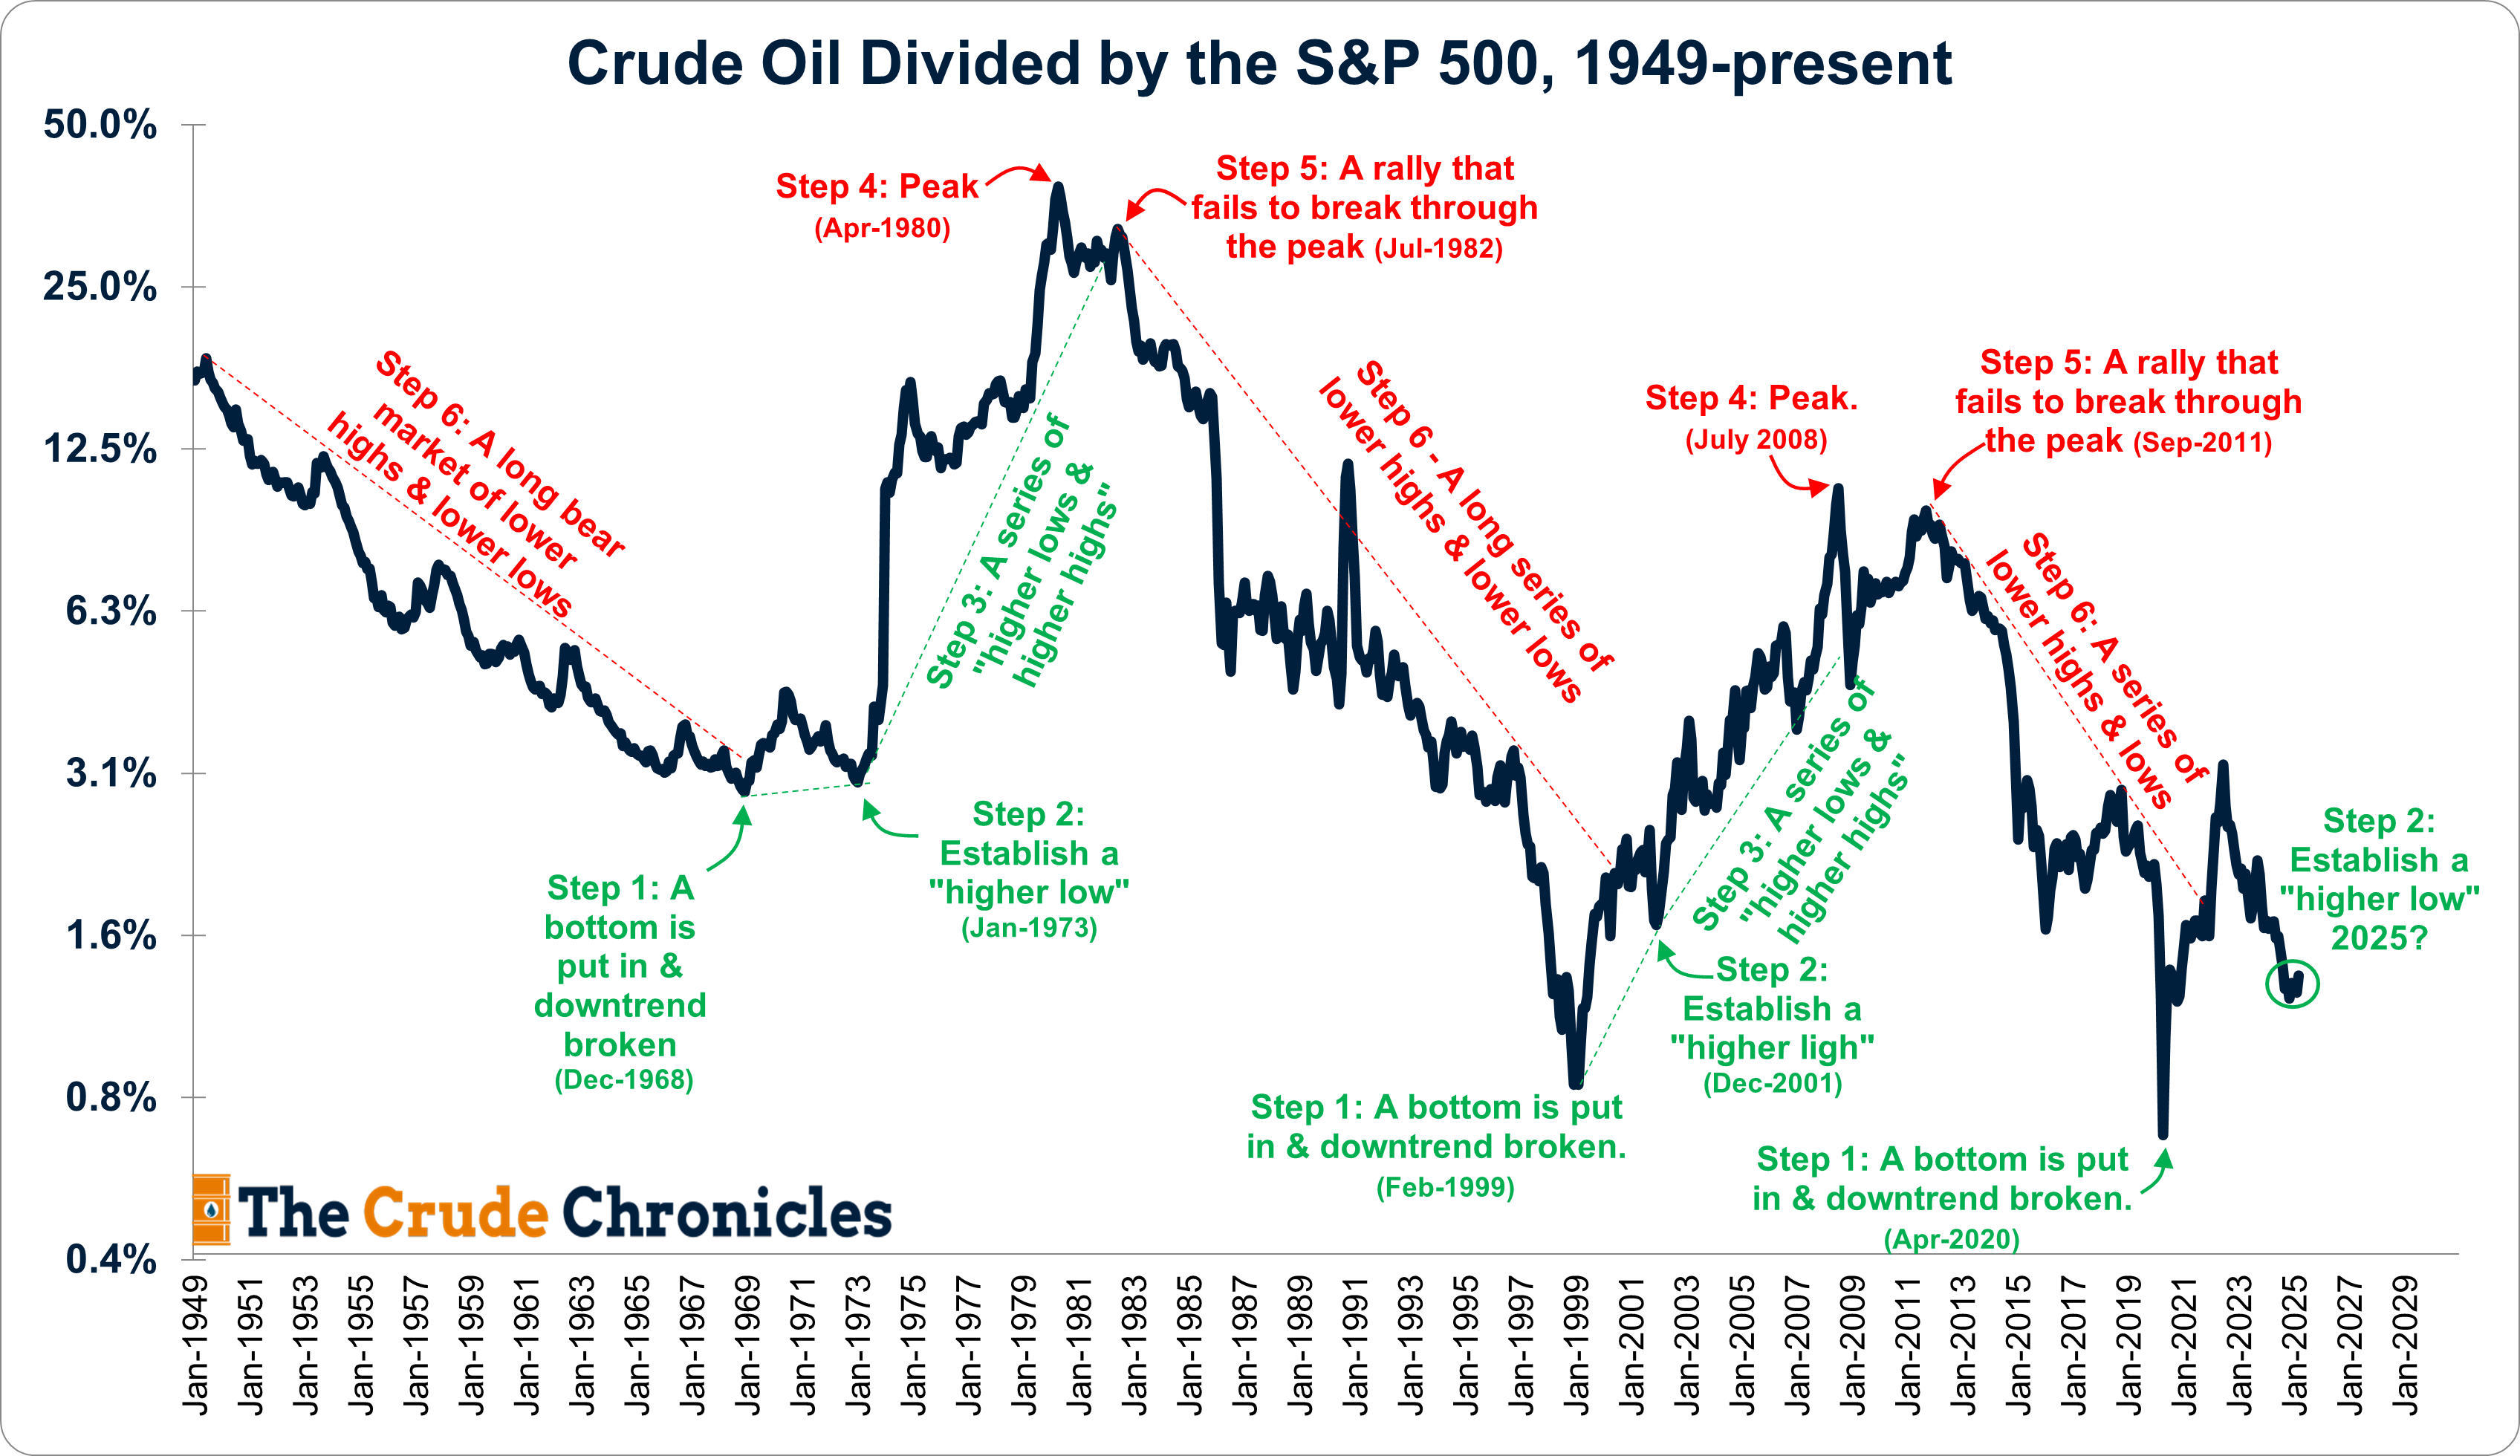
If you have been following for while, you know I consider this chart to be the most important of all the ones I have created. Oil divided by the S&P 500 or Large Cap U.S. Equities.
I use it to call the peaks and bottoms in the cycles.
These cycles alternate price leadership every 12–13 years.
I truly do believe we made another major bottom in April 2020, and for two years, that call proved correct through June 2022.
Since then, we have been facing an uphill battle—or perhaps I should say a downhill slide, as the Oil-to-S&P ratio has trended downward.
I transformed the above chart into a zoomed-in version starting from 1949 and found a regular pattern that occurs:
Step 1 - A bottom is put in.
Step 2 - The downtrend is broken, and a higher low is established.
Step 3 - A long series of higher highs and higher lows.
Step 4 - The peak is put in, and few notice it.
Step 5 - Oil-to-S&P rallies but fails to break through the peak established in Step 4, signaling to sell.
Step 6 - A long series of lower highs and lower lows.
Rinse and repeat.
If this seems like technical analysis at the highest level, it’s because it is. I applied many of the teachings of the famed technician Louise Yamada, in Market Magic (HERE).
After the publication of her 1998 book, within months, the oil-to-S&P ratio would make a bottom. While she didn’t specifically use the oil-to-S&P ratio in her book, she favored her capital goods-to-consumer goods ratio, which is another way of expressing value vs. growth—akin to oil-to-S&P.
I repeat the chart again with out much of the text to draw out the observation that oil to SPX is trying to find a toe-hold here.
We’re back to late 1998 and pre-COVID crash levels.
This is partly due to oil’s sell-off in the fall of 2024, driven by concerns over OPEC flooding the market— concerns that have been fully priced in the market. Meanwhile, non-OPEC U.S. production appears poised to disappoint barrel counters in 2025 (HERE).
More significantly, the Oil-to-S&P ratio has fallen to these levels due to the pervasive AI mania that has infiltrated every aspect of society.
Over the holiday weekend, some of my most financially irresponsible family members—who have never previously owned a stock in their lives—bragged to me about their tech-heavy portfolios. (Note this post was published in January).
Zooming in on the daily trends, the ratio looks intriguing. After touching 6,100 in early December, the S&P 500 has been languishing during what are historically seasonally strong months for stocks.

Put another way, the most important chart in commodities may be telling us something.
Let’s watch and listen!
-Rob Connors, CFA, CPA, Oil to S&P Watcher.
Disclosure & Terms of Use
Nothing in this content should be considered personalized financial advice or a solicitation to buy or sell any securities.
The content provided here is for informational purposes only. You should not construe any information or other material as investment, financial, tax, or other advice. The views expressed by The Crude Chronicles LLC are solely their own. Nothing in this content constitutes a solicitation, recommendation, endorsement, or offer to buy or sell any securities or other financial instruments in any jurisdiction. An investment in any financial instrument involves risks. Some or all the securities discussed may not be suitable for you. Please consult your own investment or financial advisor for advice related to all investment decisions.
Terms of Use: Paying subscribers are permitted to use these charts for their own use (i.e. sharing internally or within published research to external clients) provided proper sourcing is used. Please source as "thecrudechronicles.substack.com"