The Gist: (1) The consensus on oil is in the midst of shifting to a more bearish view, but the question becomes, "What's next?" (2) Leading indicators for hiring and wages point to further deceleration at a time when inflation remains sticky. The result is lower real wages, impacting U.S. oil demand. (3) But this time truly is different, with little risk of another late-cycle U.S. production boom in 2H24. The next thing to watch is for oil divided by the S&P500 to make a "higher high."
Many of you know me as the long-term oil & gas history guy, but I've had some views coming into the year that have been a little bit shorter term and tactical in nature.
I want to update you on a couple of my thoughts as well as some things to watch.
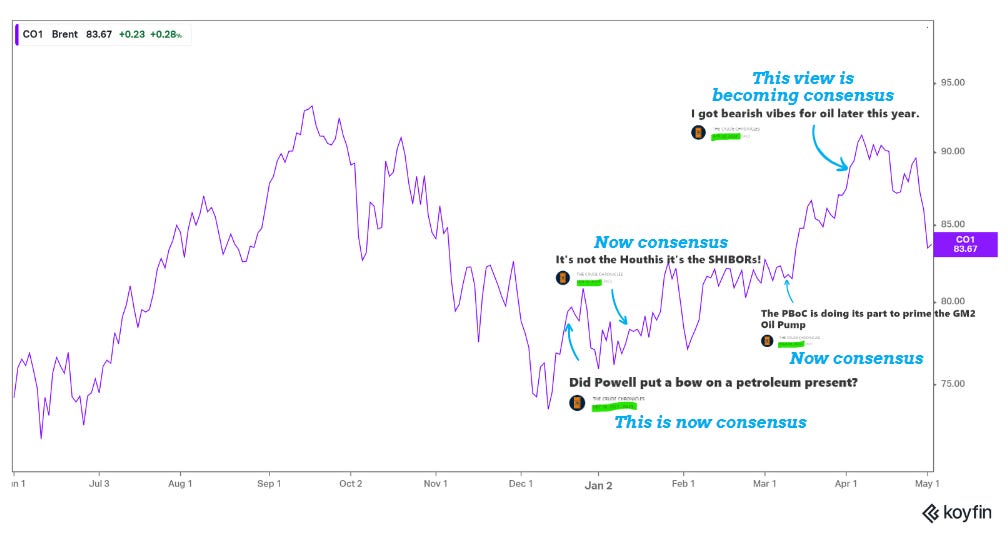
I sort of hate this chart, but I'm going to lead with it.
Yes, I am tooting my own horn, and usually when people like me present charts like this, what you don't see are all the bad calls I have made in the past.
Yet, for the most part, the timing of my posts this year has been good.
When consensus was pretty negative coming into the year, I had been publishing some positive developments that were happening in oil at the time.
Firstly, financial conditions improved due to Powell’s easing of forward guidance, and markets ripped (HERE).
After that, we saw some positive developments happening out of China as the PBOC started pumping liquidity into the system (HERE).
Coming into April, all of that started to shift, with commodities having surged.
Copper is at new highs, precious metals are at new highs, and iron ore has recovered.
In late March, I was in Mexico with the family on some R&R and started to get some bearish vibes.
I put out this post (HERE) on April 2nd, and I got a lot of pushback.
Right now, price is driving narratives, and this view is starting to become consensus.
But what comes next?
In the oil markets, there are a lot of things to stay up to date on.
There is China demand, OPEC production, shale production, inventories, etc.
Yet, if you're going to track one thing, it is the U.S. consumer. If you get U.S. oil demand correct, you will most likely get the oil markets correct.
This chart shows that real wages drive U.S. oil demand, and the U.S. consumer needs about 2% real wage growth for demand to grow.
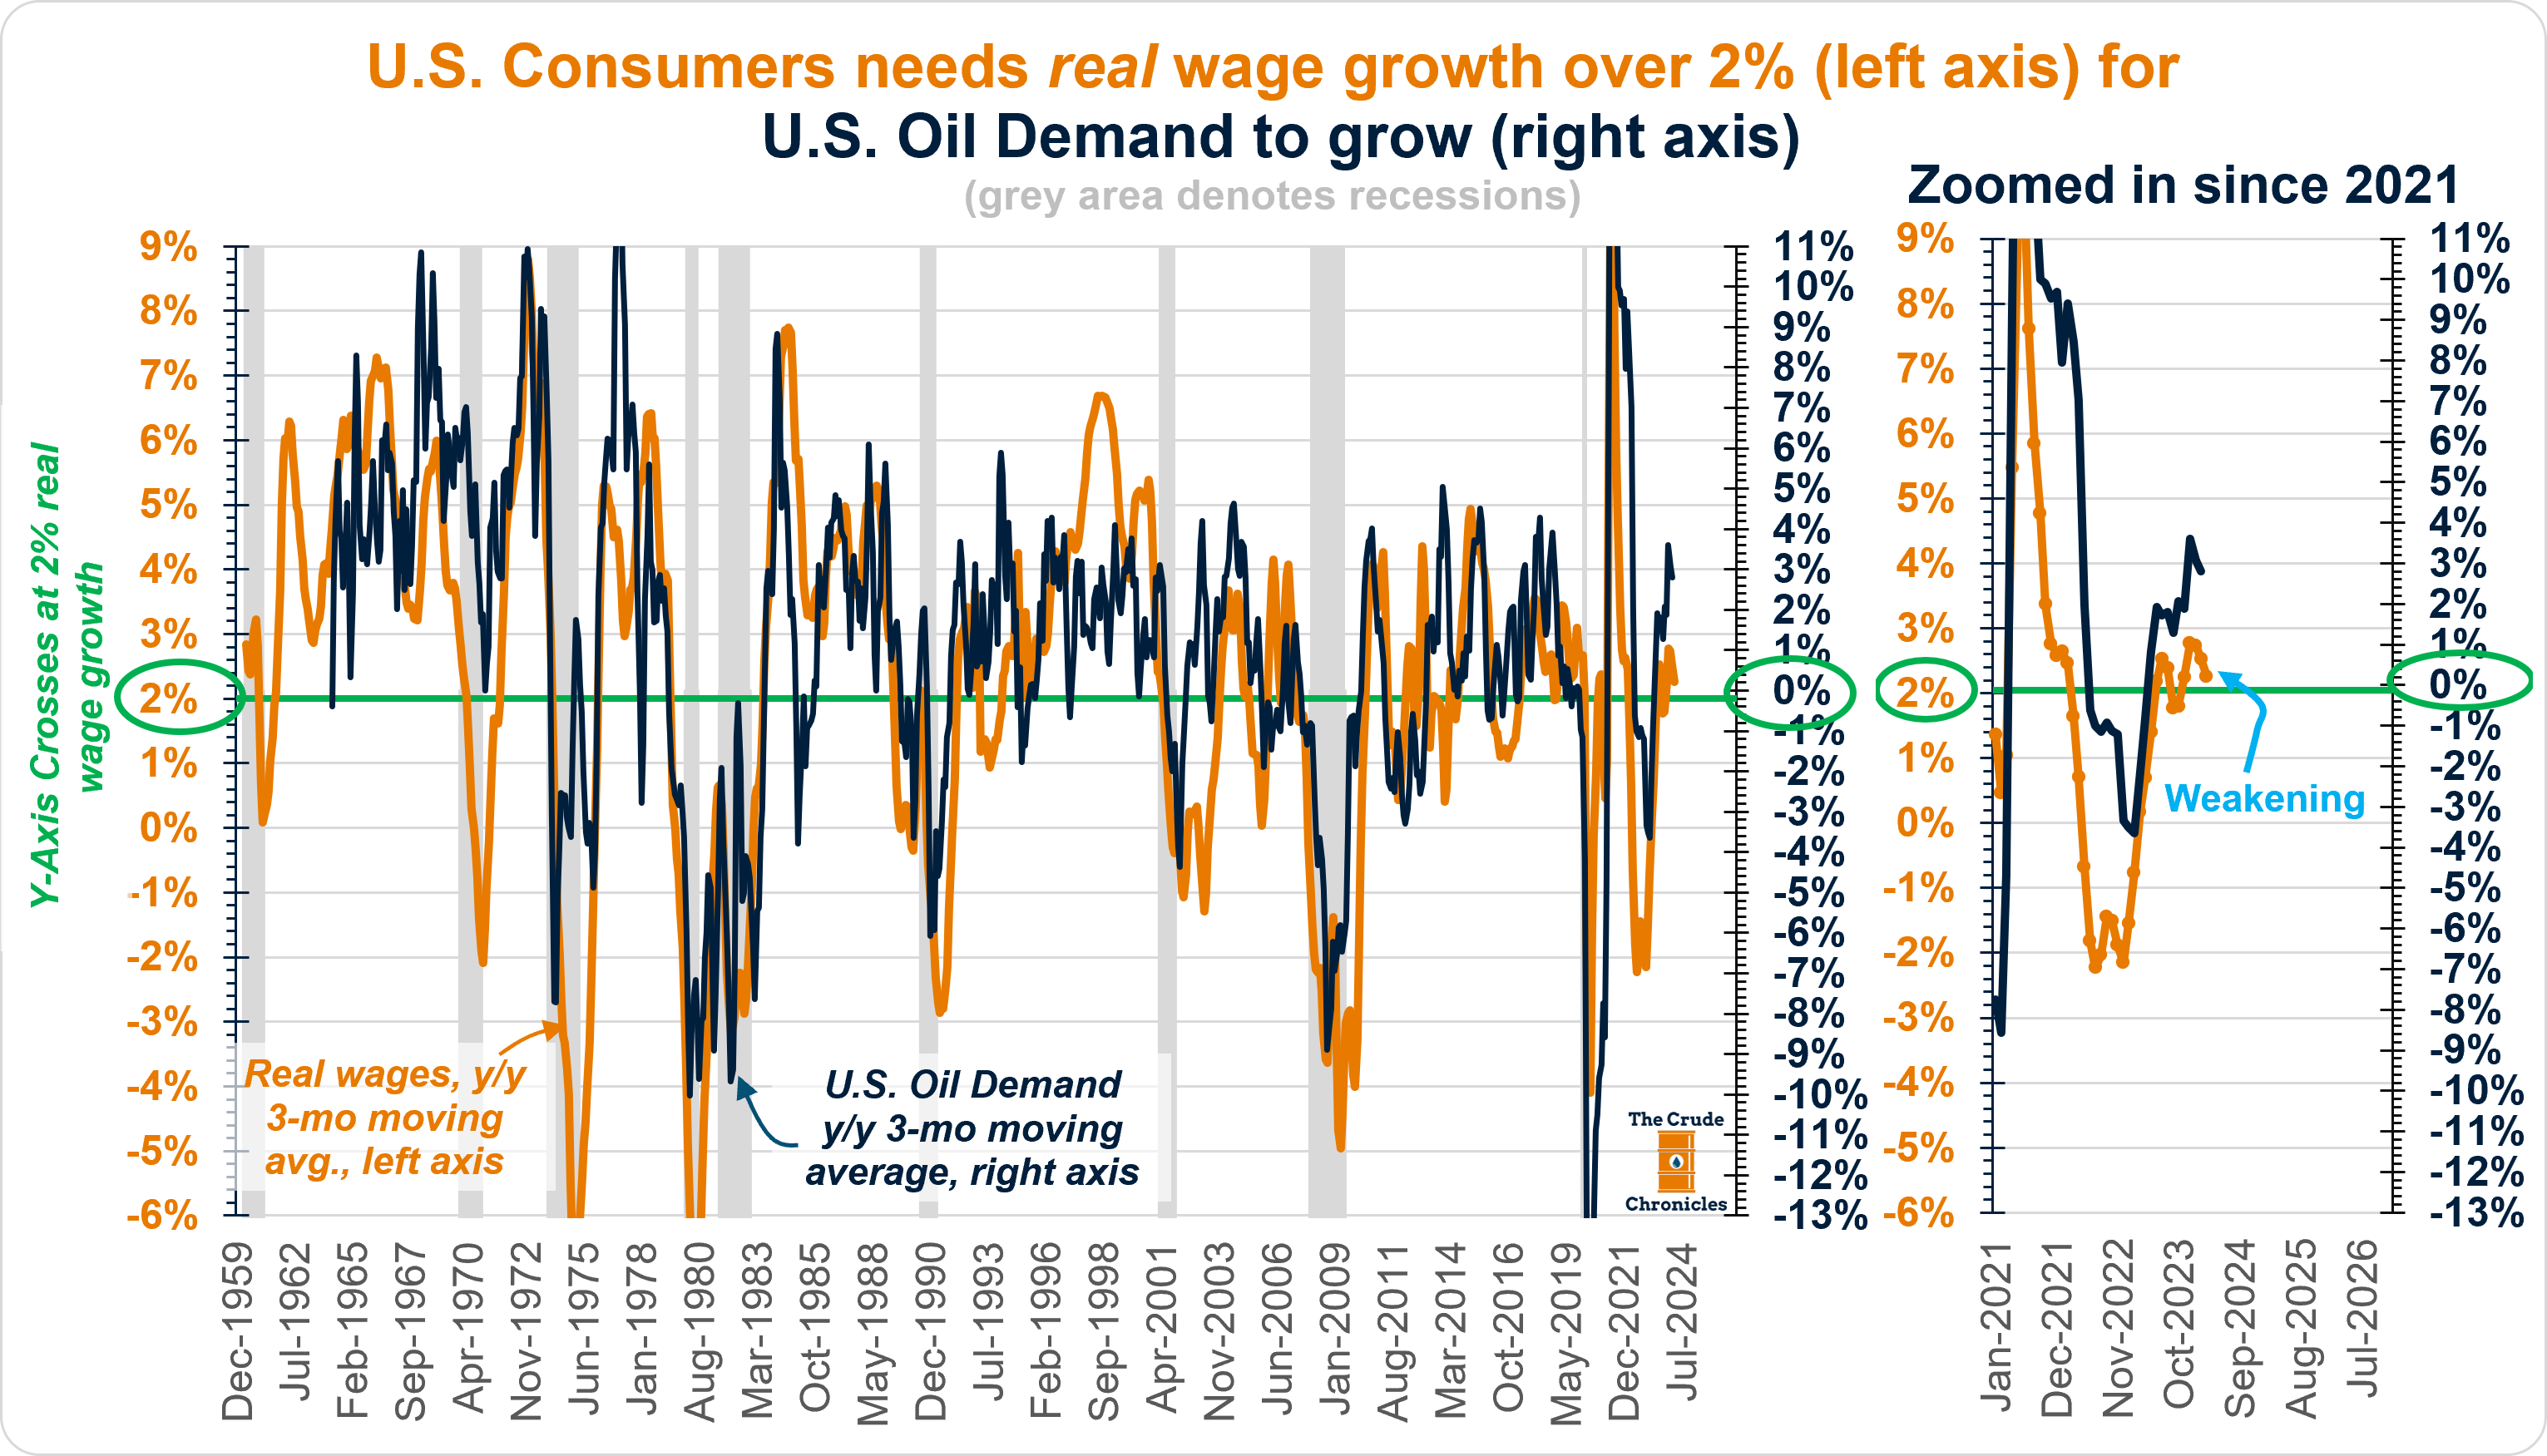
Quite frankly, I think U.S. oil demand has some headwinds in the back half of 2024 because, as the chart shows, real wages—simply the difference between nominal wages and inflation—are decelerating towards that critical 2 percent barrier.
The orange dotted line of real wages' 3-year moving average stands at about 2.3% growth and has clearly been weakening of late.
What drives real wages?
Simply put, it's the balance between demand and supply of labor as shown below.
Listen to this episode with a 7-day free trial
Subscribe to The Crude Chronicles to listen to this post and get 7 days of free access to the full post archives.