The Gist: (1) A turn in the capital intensity cycle drives OFS revenues. Margins continue to recover as rig utilization rates improve. (2) Balance sheets have fully recovered as debt levels have been worked down and capital spending remains low. (3) OFS is in a "recovery cycle," with a larger “reinvestment cycle” possibly beginning later this decade when OFS tends to outperform in a “typical” late cycle fashion.
Welcome back, everyone. Today we're going to talk about revenues, margins, balance sheets, and all the fun stuff for the oilfield service industry, with some charts going back well over a hundred years as usual.
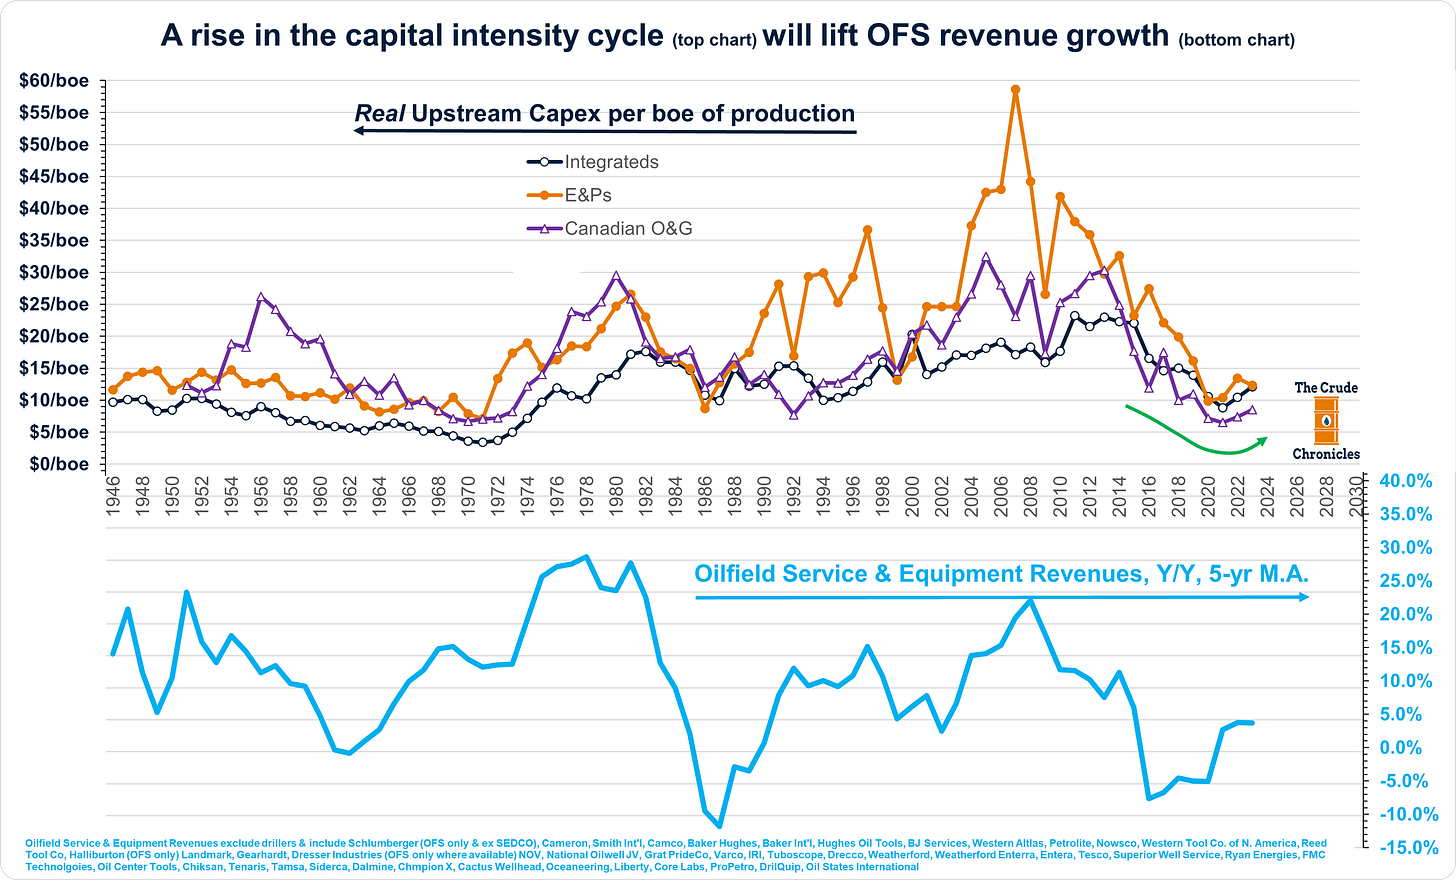
So, the first chart I'm going to lead off with aims to show you what drives revenue growth cycles: the capital intensity cycle of their customer sets.
The way I showed this is that the top chart shows inflation-adjusted upstream capex per BOE of production for the Integrateds, E&Ps as well as Canadian oil and gas names.
And I know what you're thinking: the NOCs are left off this chart, but I'm collecting the data to add them in a later post. In the bottom half of the chart, you see oilfield services revenue growth on a five-year moving average basis.
When their customers are spending more per BOE of flowing production, it tends to drive increases in oilfield services revenue growth.
As capex per boe turns up one tends to find, the producers need more services, more products, more well logging, more digital services—the list goes on and on.
The capital intensity cycle turned up after COVID and continues to trend higher.
Let's move down the P&L to gross margins. The bar shows gross profit margins, on average, since the fifties, and this tends to oscillate with rig utilization rates.
The dark blue line represents U.S. utilization rates, while the orange dotted line indicates the average of offshore utilization rates.
Margins have recovered for three years in a row, but utilization rates of drilling rigs still remain relatively low compared to historical levels.
To see gross margins and thus pricing continue to improve, rig utilization will need to continue to trend higher from here.
Now, the story is a little different for operating margins, or EBIT margins. The next chart is a bit messy, with tons of oilfield service names throughout history.
Listen to this episode with a 7-day free trial
Subscribe to The Crude Chronicles to listen to this post and get 7 days of free access to the full post archives.


