

The Gist: (1) Big Tech has a capex lesson to learn from Big Oil. It took time but O&G is now a less volatile sector with 7-9% real returns per annum for the next decade. (2) The fundamental drivers for oil and gas equities are still in play: excessive money creation, slowing well productivity growth, and higher development costs. (3) The weakness in the labor markets (now consensus) will affect oil markets (becoming consensus) but on the other side of it the O&G equities should come out ahead with refiners the first out the gate.
(Note: the charts and text below were updated after the July ISM print but the video was recorded beforehand)
What's up, everyone? Welcome back. I hope you're all enjoying your summer. I'm a little bit more tan myself, so I've definitely been enjoying the sun.
Lately, I've noticed that my tactical views are starting to become consensus so rather than just overconfidently pat myself on the back (that never ends well), let’s use this post to update you on some of my views, both longer-term (bullish) and shorter-term (bearish). But more importantly, let's try to discuss what might come next.
Big Tech has a capex lesson to learn from Big Oil. It took time but O&G is now a less volatile sector with 7-9% real returns per annum for the next decade.
So, let's just touch on this chart real quick.
I posted this on the app formerly known as Twitter.
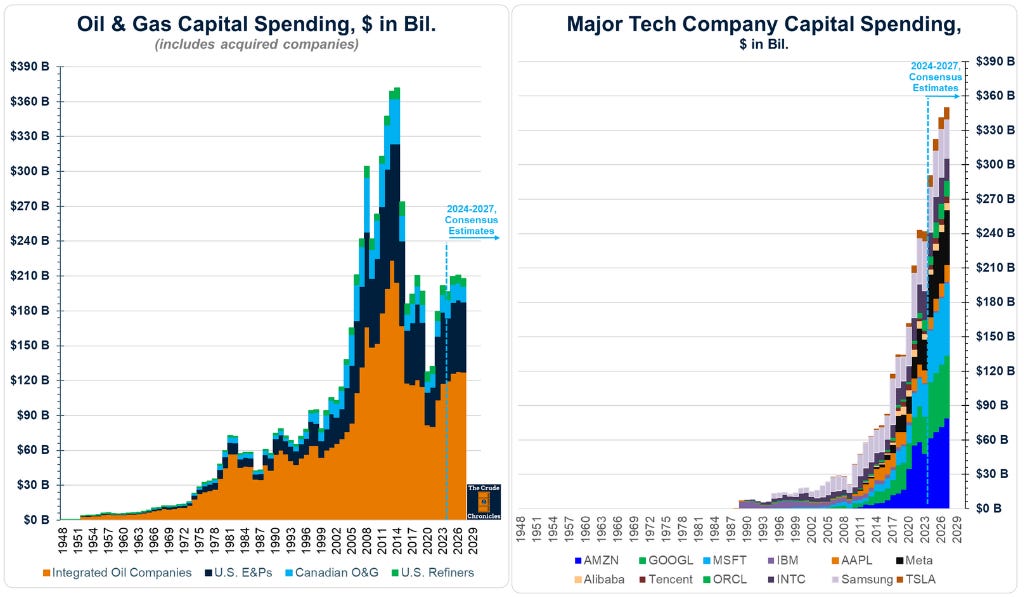
It is quite amazing how the tides have turned. We have the summation of capital spending for Integrated Oils, E&Ps, Canadian Oil and Gas, as well as U.S. Refiners on the left and Mega Tech on the right.
When I began my career, we were running out of oil & gas, and capital spending grew on the order of sixfold, from about $60 billion in the mid-nineties all the way up to $360 billion by 2014.
If we look at these big tech companies on the right and use consensus estimates out to 2027, they are pretty much spending close to what the oil and gas sector as a whole was spending back in 2014.
Obviously, the decade after 2014 was not favorable for oil and gas. Will the next decade be favorable for tech companies?
Something to ponder. My answer is no.
I updated my industry beta chart (HERE).
During a bull market for stocks, its not good to have a sector beta that is falling. However over the last several weeks we have seen quite the opposite.
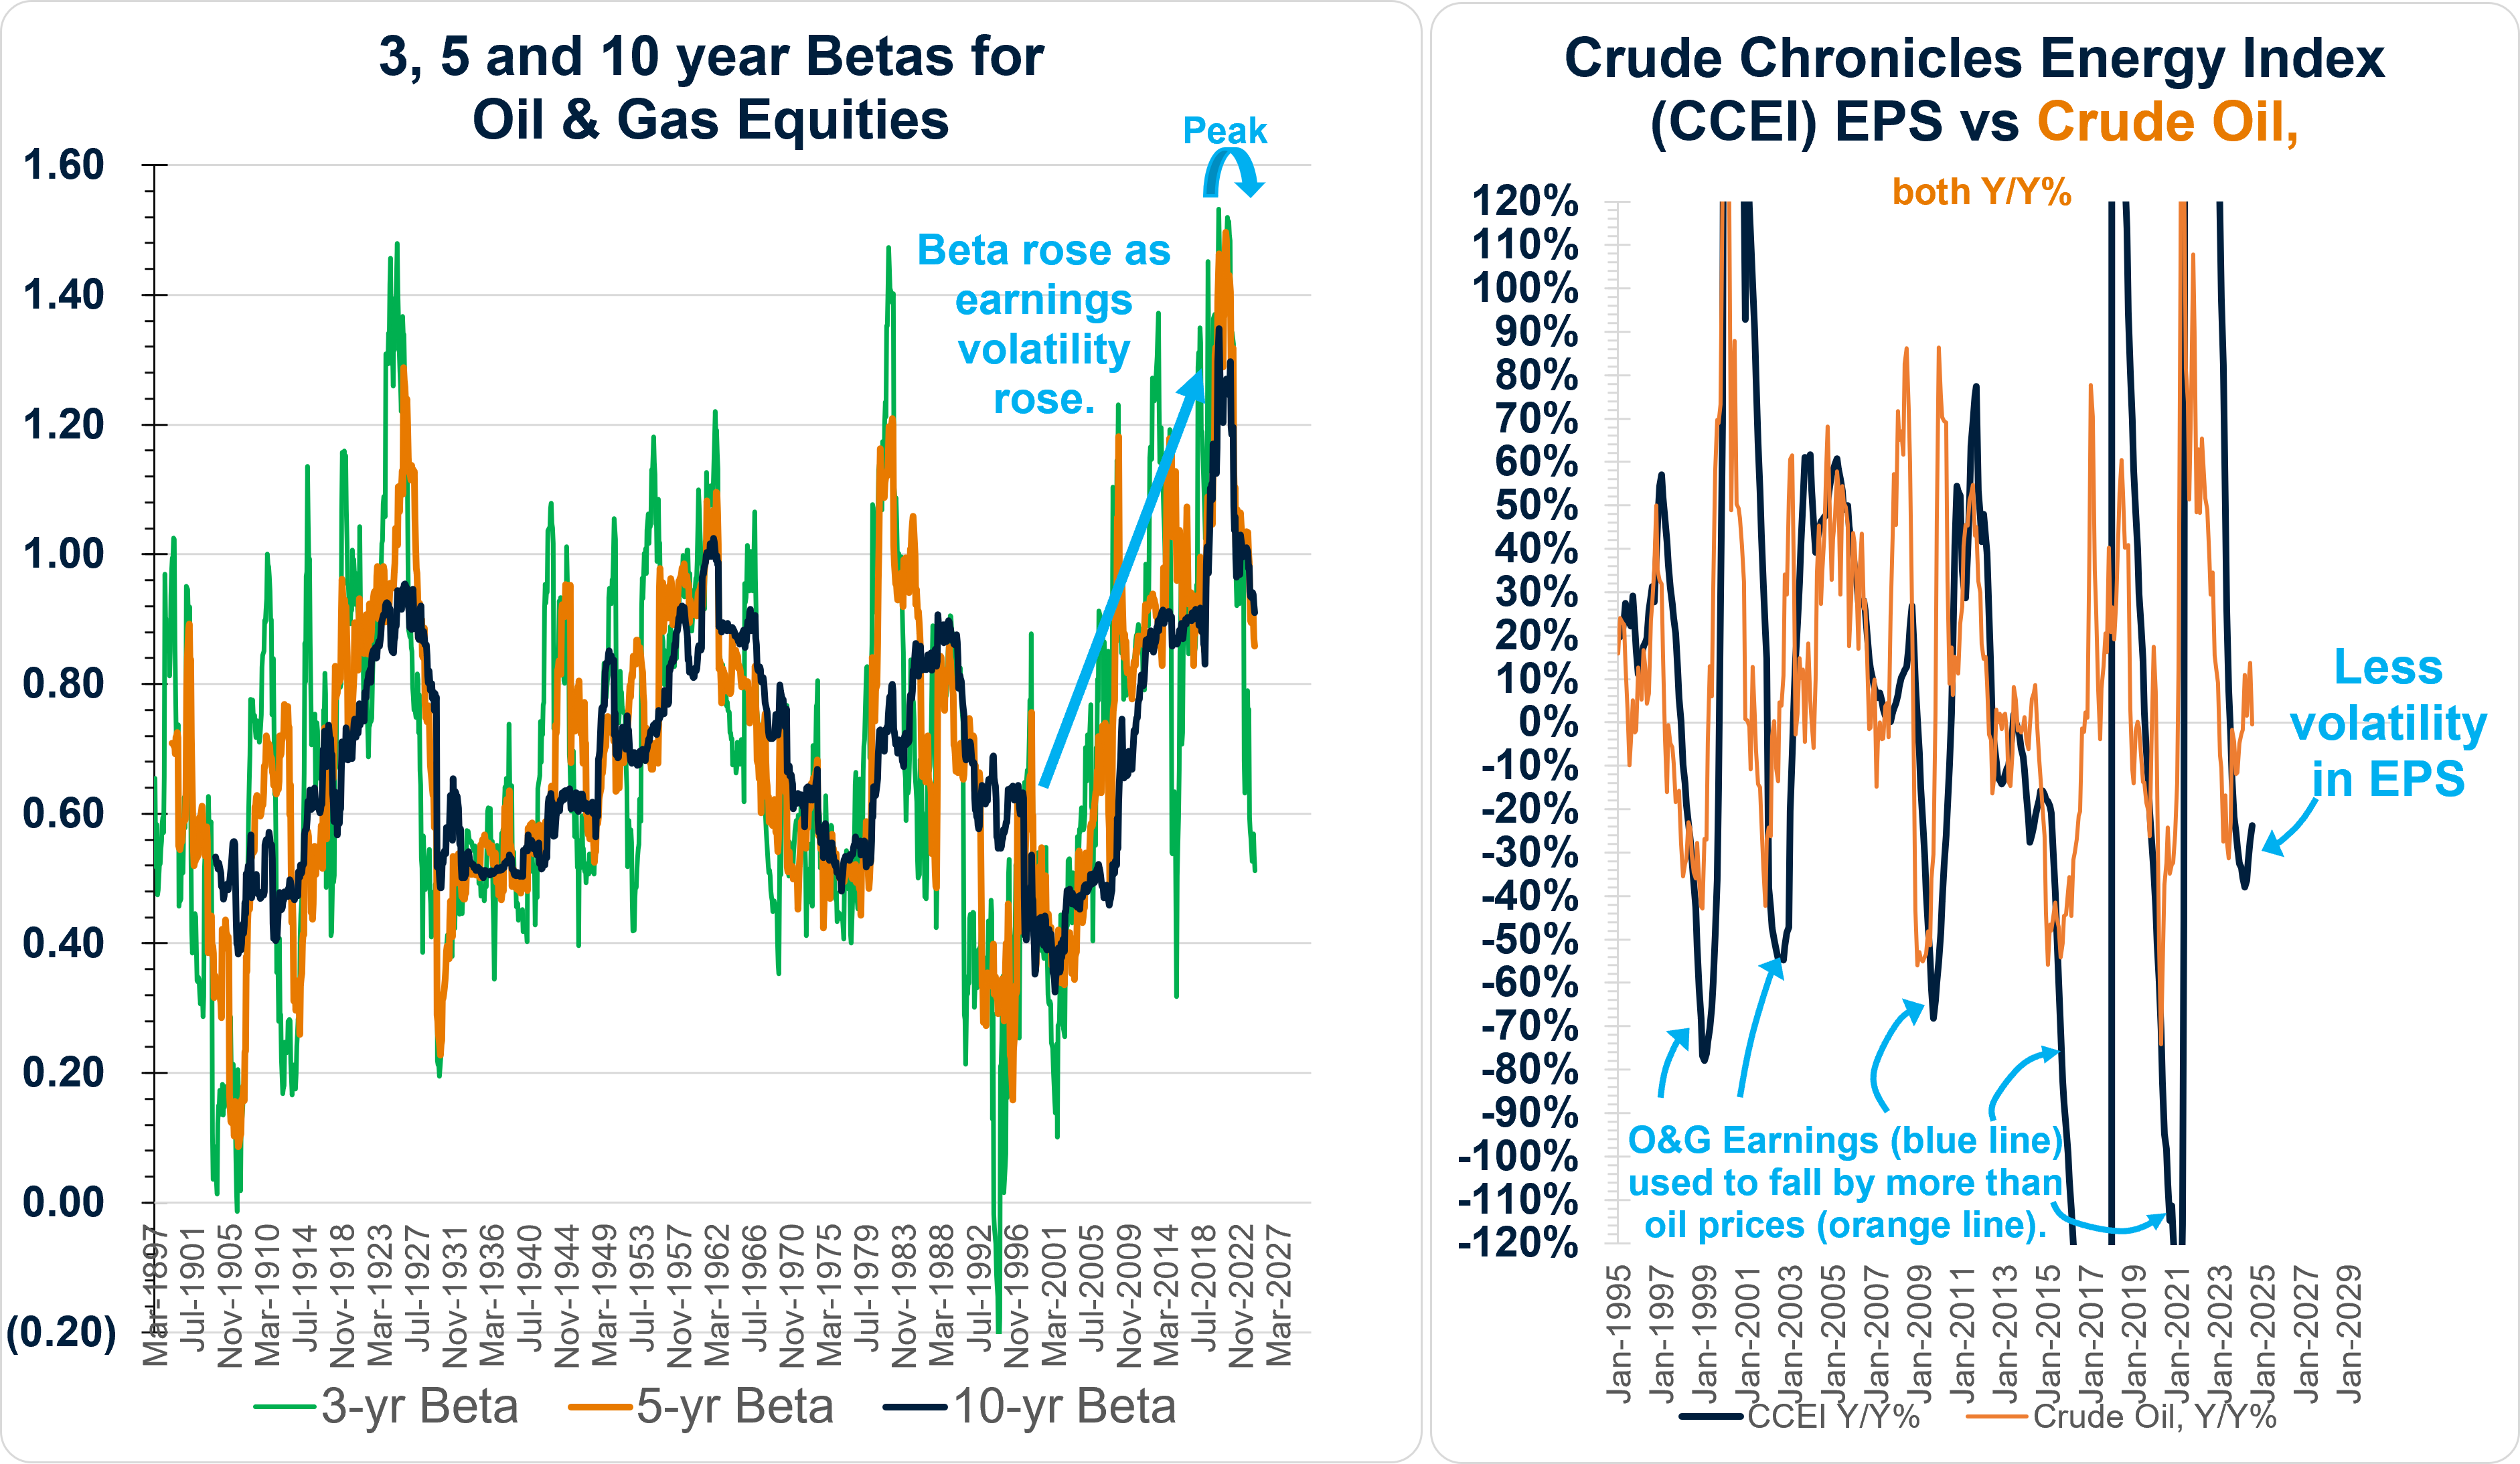
On the left, we have the rolling three-, five-, and ten-year betas for oil and gas equities going all the way back to 1894.
Of late, falling betas has been beneficial for energy stocks as they have held up better than some of the aforementioned high-flying tech companies that have come to dominate the S&P 500.
Since the late nineties through COVID, industry beta rose.
The reason the sector became more volatile is shown on the right. I plot the year-over-year earnings growth rate for my Crude Chronicles Energy Index versus crude oil prices. During the downturns in '98, '01, '08, '14, and in 2020, earnings always fell by more than the commodity.
The companies became more volatile than the commodity from which they derive all their profits.
For the first time in almost 30 years, it looks like earnings have fallen in line with oil.
I believe that is what explains the reduction in beta on the left.
Now, if stocks are in a bull market, like we've been in since 2020, and industry beta is falling, that's not a good thing because O&G is participating in less of the upside.
However, during the choppy markets that have developed of late, it becomes beneficial.
Simply put, these are better-run companies with better management and better strategies.
And then finally, to sum it all up, the best long-term predictor of the sector’s future returns is energy's market cap as a percentage of GDP, which has indicated the subsequent real 10-year total returns per annum after inflation.
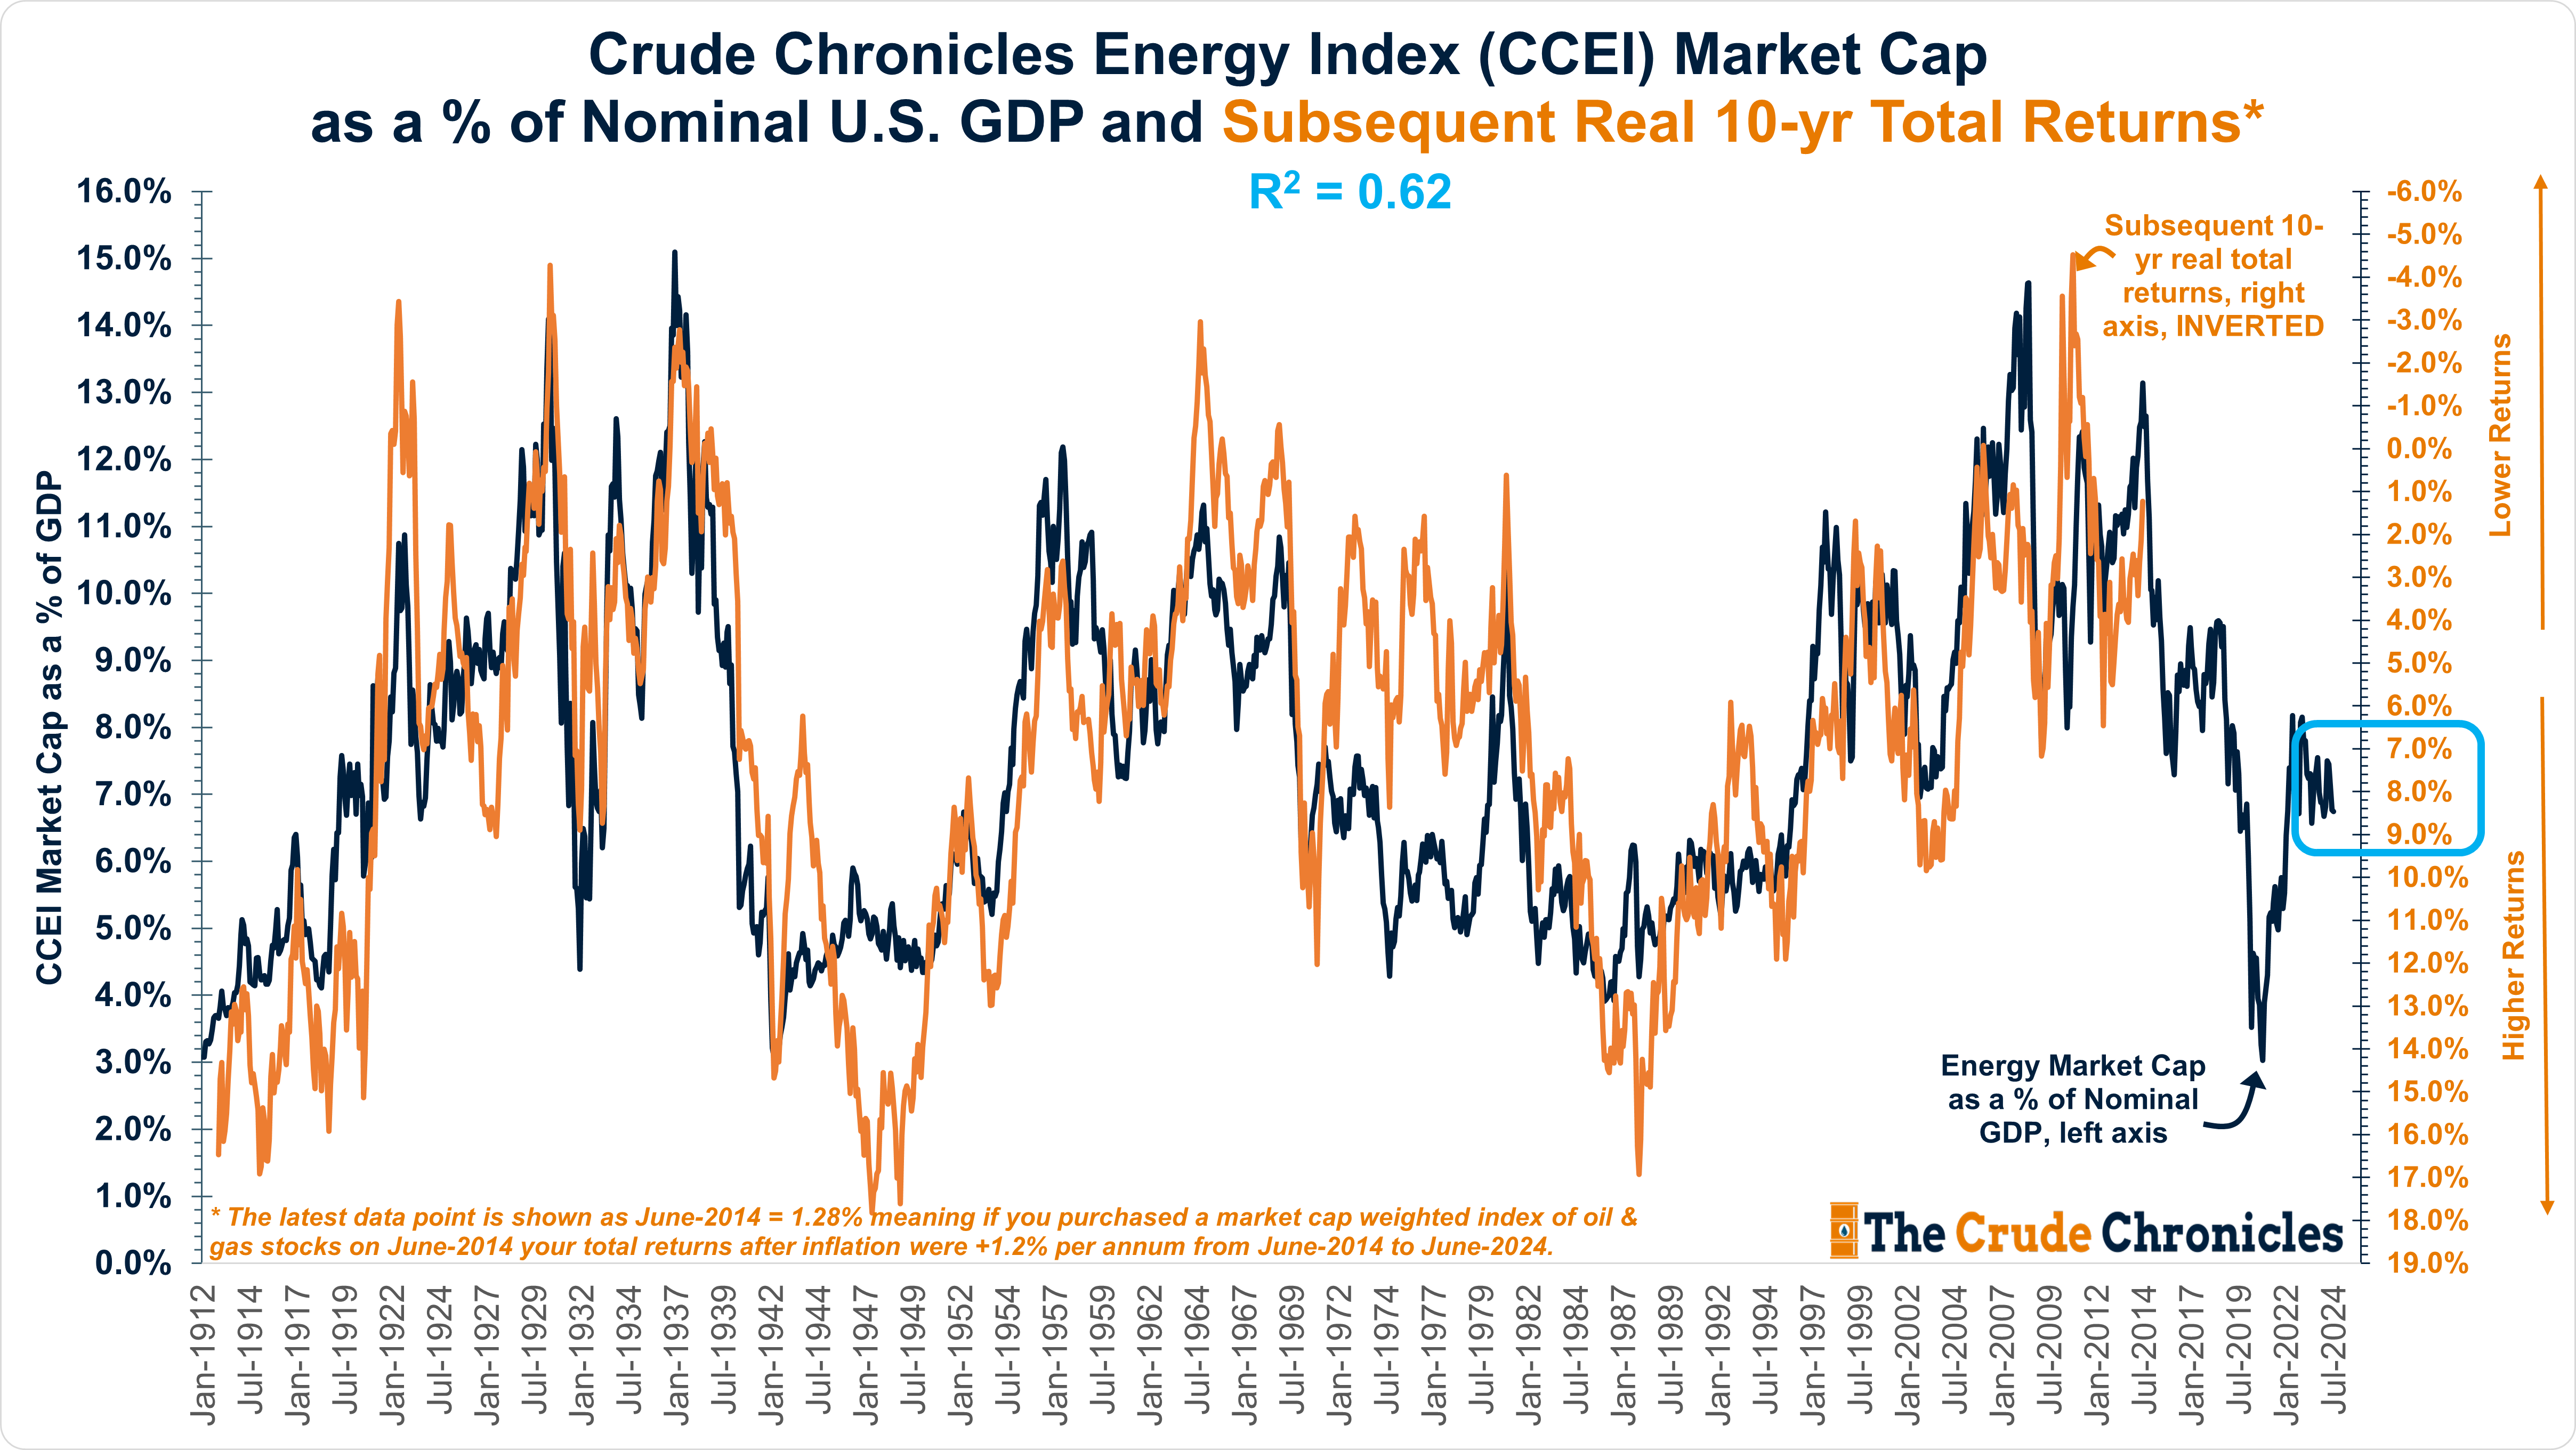
The blue line represents energy’s market cap as a percentage of GDP, which now stands at 7% on the left axis.
The orange line represents the ex-post 10-year total returns per annum after inflation.
The 100+ year relationship suggests returns after inflation of around 7%-9% per annum for the next decade, which will clearly be better than the last 10 years.
The fundamental drivers for oil and gas equities are still in play: excessive money creation, slowing well productivity growth, and higher development costs.
Having studied commodity cycles, one finds they simply do not exist unless there is an excessive amount of money creation by governments around the world.
Our elected officials run the printing presses for two reasons. The first is to deliver a social spending program they promised their constituents with no idea how to pay for it.
The second is to finance a war.
Right now, governments around the world seem bent on doing both.
Listen to this episode with a 7-day free trial
Subscribe to The Crude Chronicles to listen to this post and get 7 days of free access to the full post archives.


