

The Gist (1) For over 100 years, Chevron and ConocoPhillips have exhibited distinct trading ranges relative to the S&P, with observable cycles of ups and downs lasting decades. (2) This observation does not hold true for other oil & gas mega caps such as XOM, BP or Shell.
Note that for the purposes of this post, I simply use the share price divided by the S&P 500 index price.
Let’s lead off with the first chart which shows ConocoPhillips share price divided by the S&P 500 (orange line) while the blue line is COP EPS relative to the S&P 500.
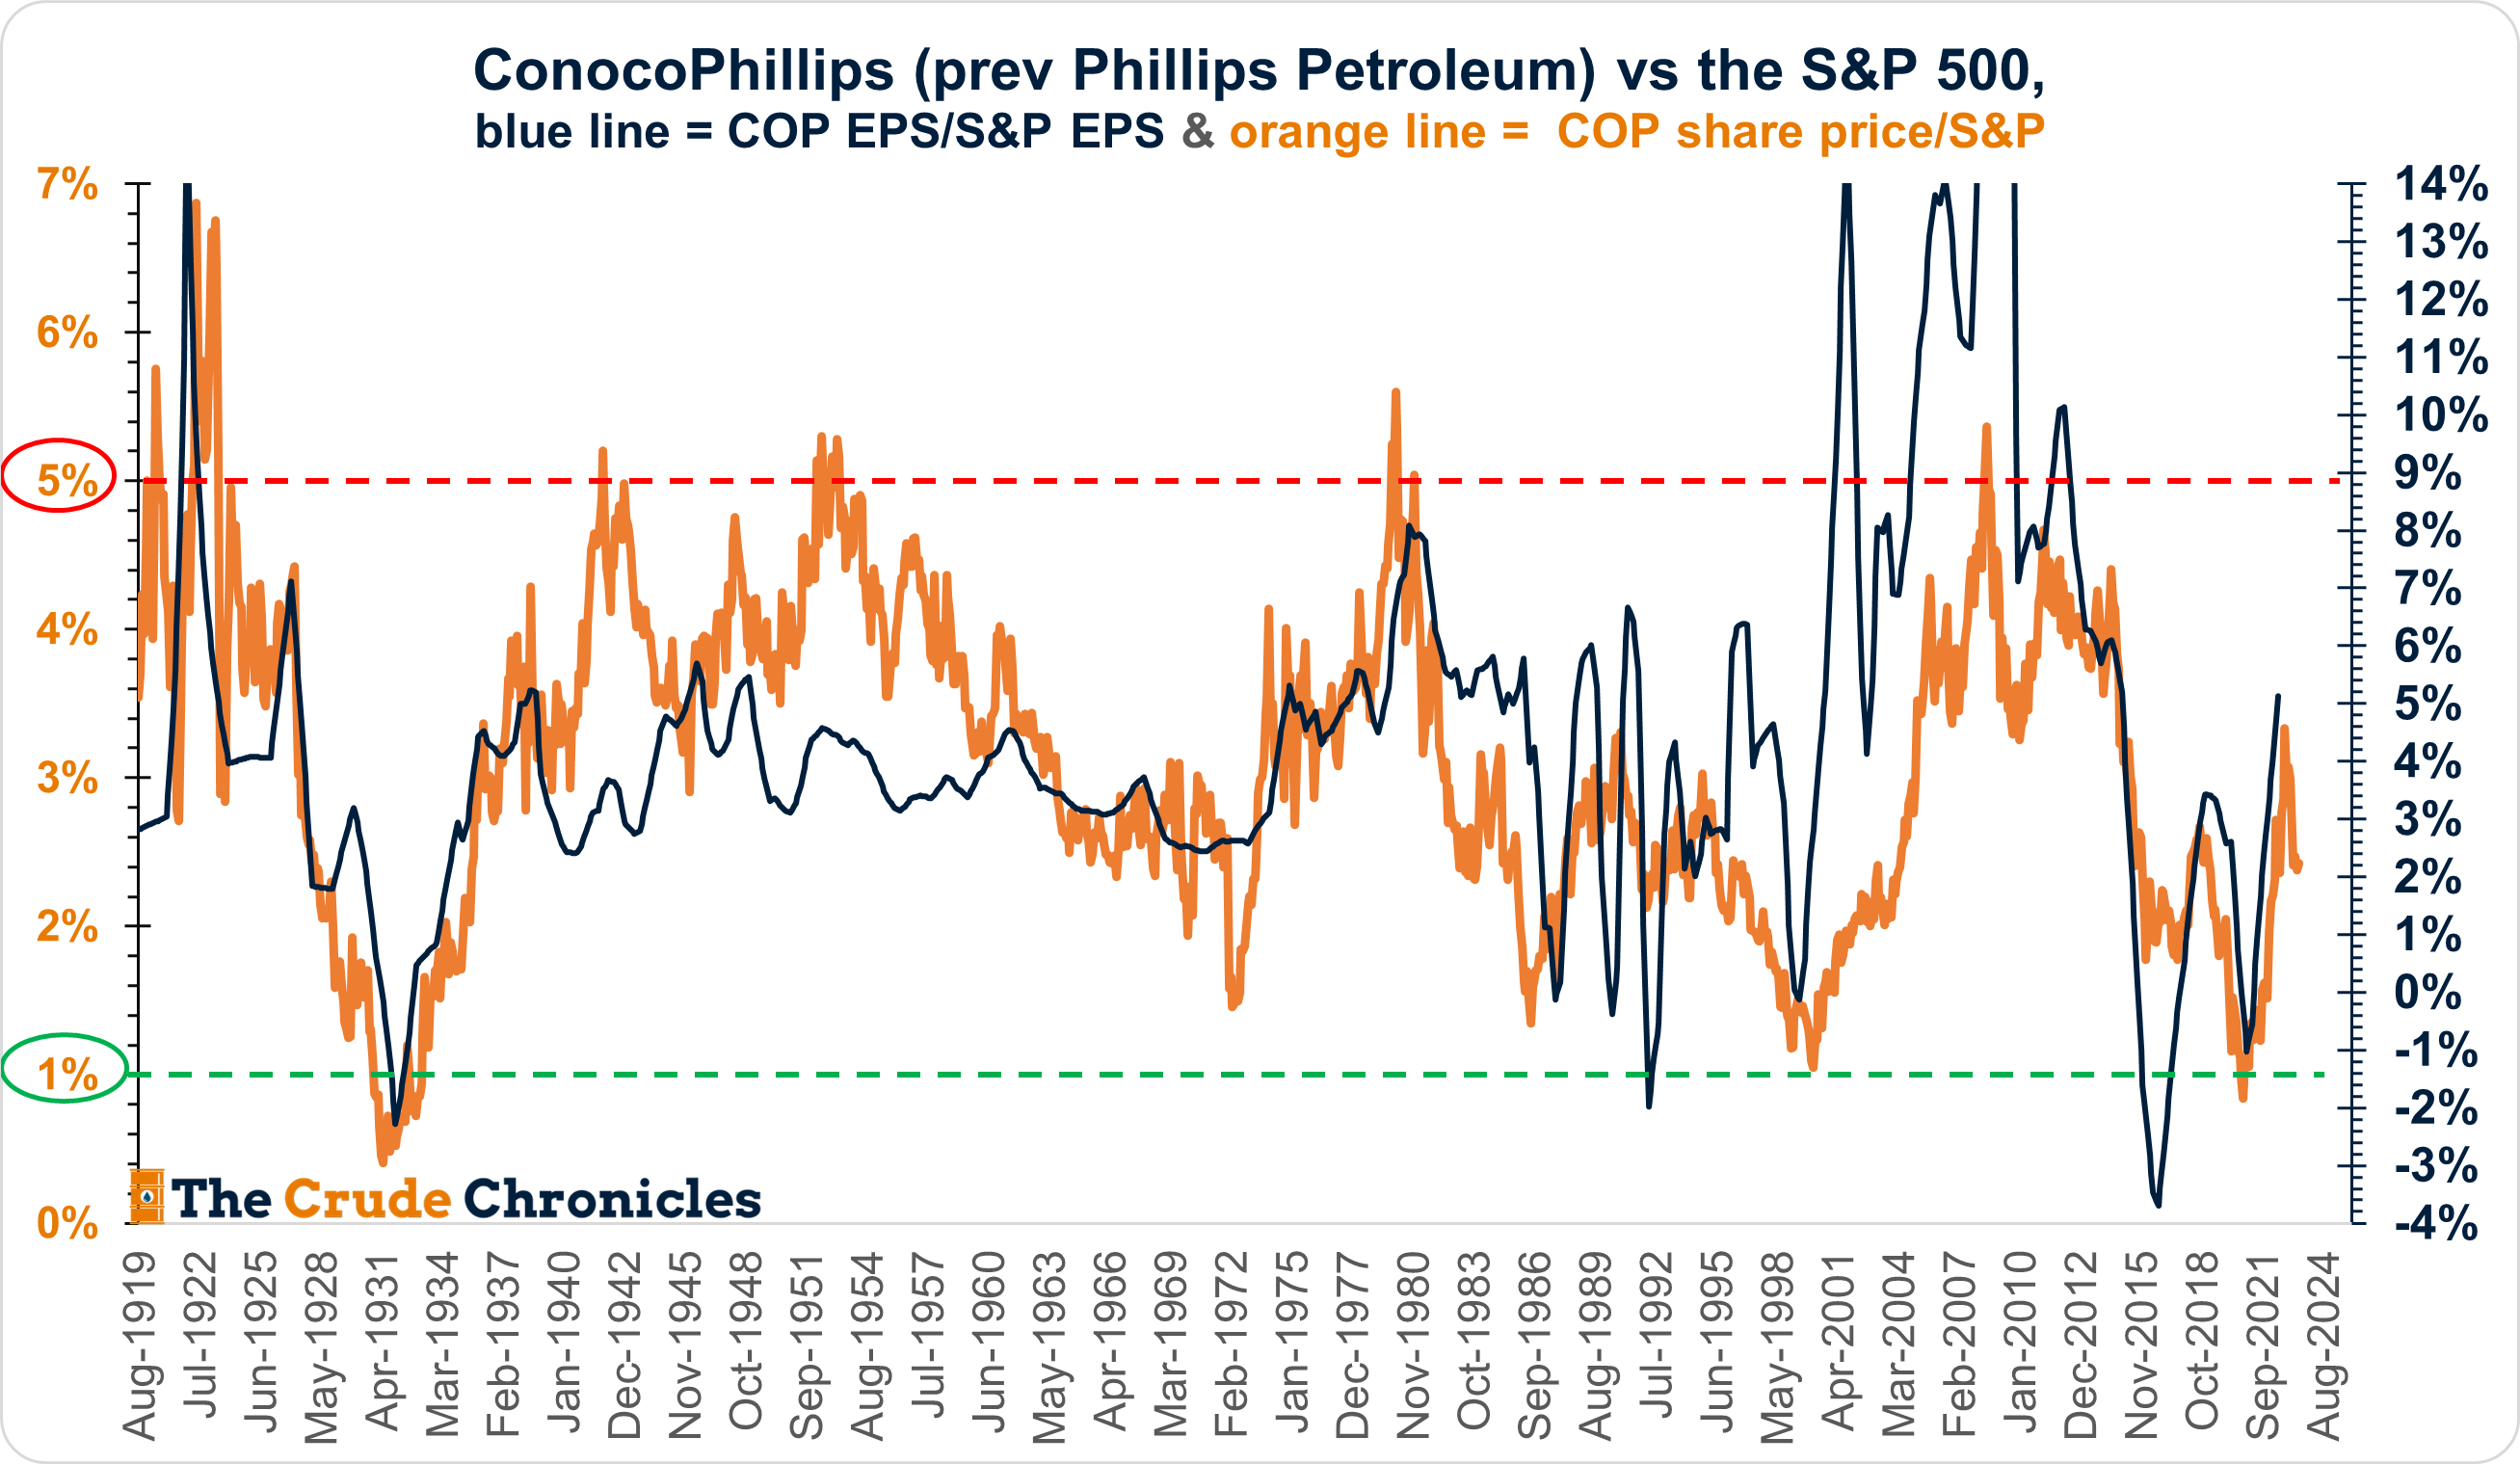
The key point is that for over a century, ConocoPhillips has been a stock that tends to move within a relative trading range of 1% (undervaluation) and 5% (overvaluation).
This pattern has persisted through various phases of the company's history, including when it was Phillips Petroleum and during its time as an integrated oil company before becoming a pure play exploration & production (E&P) company.
While the long-term average might be around 2.5%, the stock doesn't linger at this average but merely passes through on the way to its two extremes. Currently, the stock has rebounded from the undervaluation end of this range.
The second chart I want to show is Chevron relative to the S&P 500. This is the only other stock that exhibits a long term trading range within big oils, and its trading range again has been 3% to 9%.
Listen to this episode with a 7-day free trial
Subscribe to The Crude Chronicles to listen to this post and get 7 days of free access to the full post archives.


