

The Gist: (1) The refining playbook is alive and well. (2) Keep capex low & wait for an early cycle recovery. (3) Watch ISM orders vs. EIA stocks for a bounce in crack spreads.
Welcome back, everyone! I’ve updated some refining charts for you, but first, let’s start with this one on utilization.
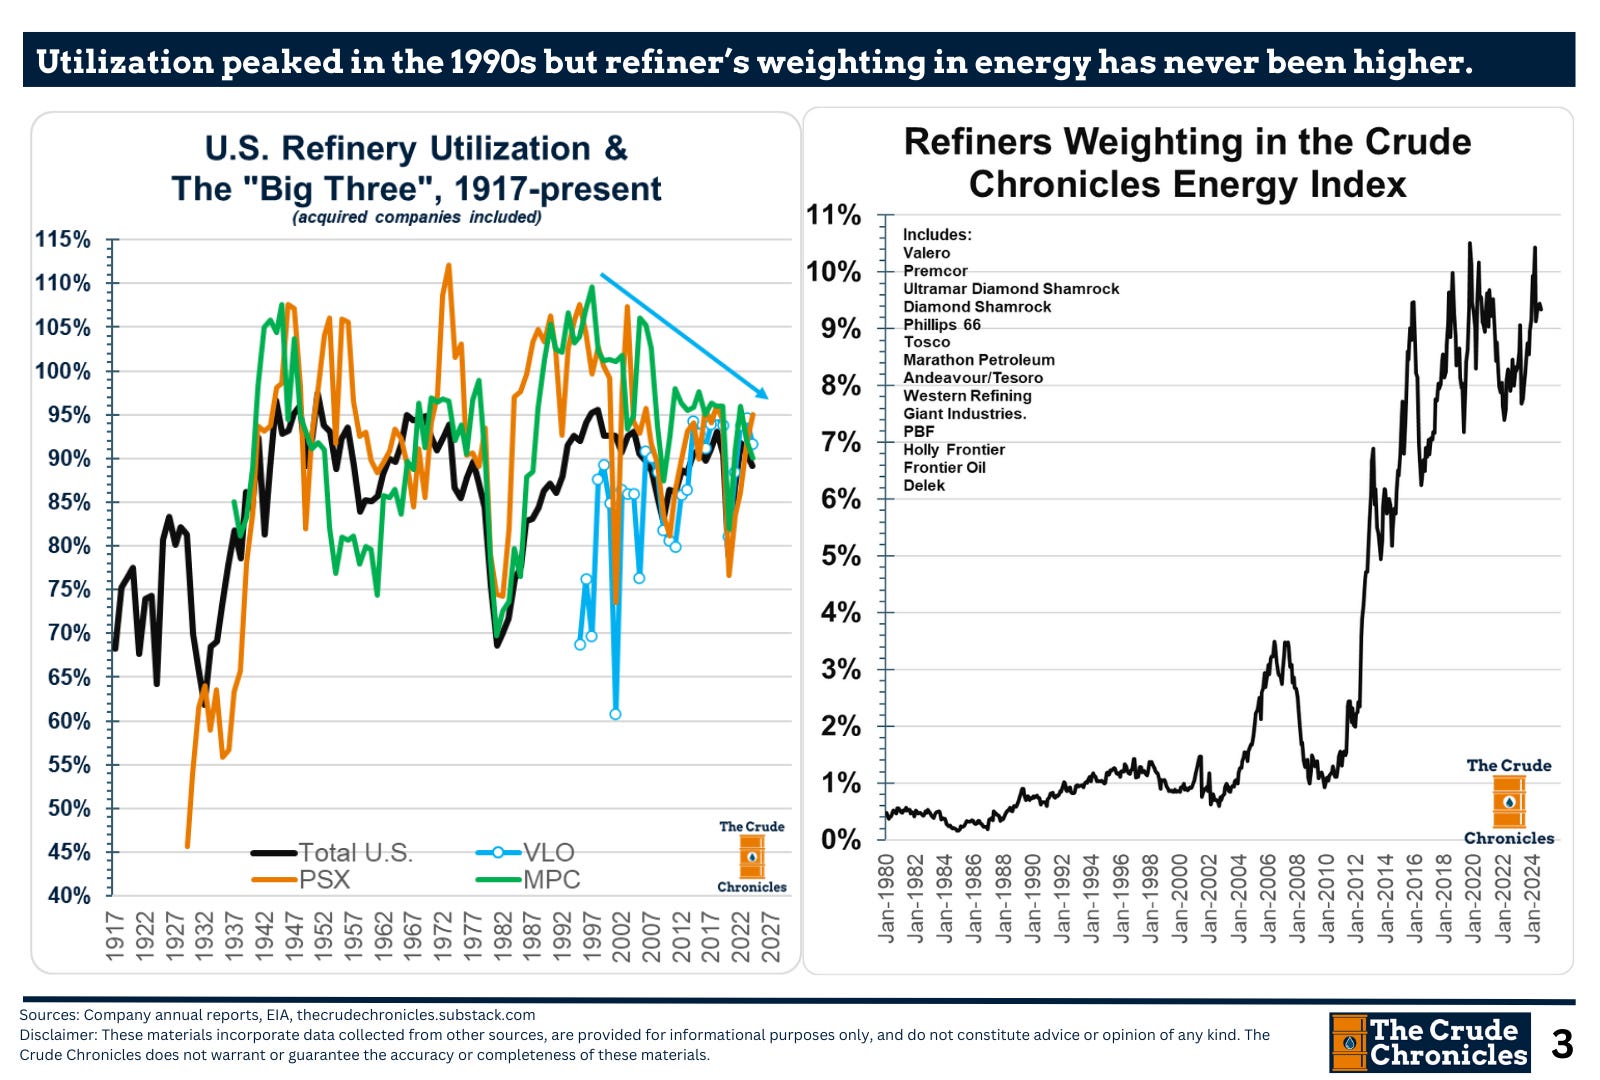
The point I’m trying to convey is that U.S. refinery utilization peaked in the mid-1990s. However, on the right, the weighting of refiners in my energy index and in investors’ portfolios has never been higher.
There are a few reasons for this:
The split of the two businesses that began in the 2000s—upstream vs. downstream.
The rise of shales and the birth of the Brent-WTI spread.
The strategy of low capital spending, which has made refining a more attractive business than it was 25 years ago.
Let me explain.
In the next chart, I show inflation-adjusted downstream capex for the integrated oil companies as well as the pure-play refiners.
Oftentimes, this industry would run into trouble when they spent too much money as evidenced below.

In the nineties, money was spent not only on increasing capacity but also on upgrading facilities to comply with the new fuel standards introduced by the amendments to the Clean Air Act.
The 2000s brought another upgrade cycle when North American refineries were modified to process heavier crudes from Canada and South America. However, shortly after, lighter shale oils were discovered.
The most recent investment cycle, which peaked in 2019, was smaller and driven by renewable fuels but, as we are seeing now, has largely been unprofitable.
Capital spending has since returned to the COVID lows.
So, the playbook remains intact.
Yet the chart above is somewhat misleading because these companies now have significantly less refining capacity and process much less crude than they did 30 years ago.
One way to standardize it is to take the numbers from the inflation-adjusted capex chart above and divide them by throughput rates, as shown below.
Listen to this episode with a 7-day free trial
Subscribe to The Crude Chronicles to listen to this post and get 7 days of free access to the full post archives.


